Introduction
The ModelOp Command Center displays a single screen with access to all of the tools to monitor and manage your models. The components on the Dashboard include the three panes in the middle of the screen, the notifications pane below, and the four icons in the menu on the left.
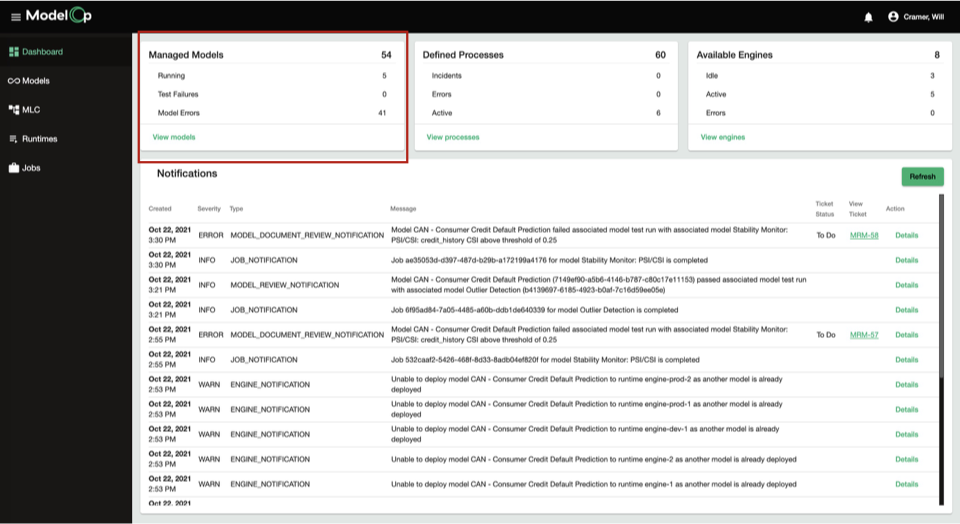
Models Pane
On the Models pane, you can see the current status of the models in your system. The Models pane shows:
The number of models that are currently registered within ModelOp Center. This is the number of models being managed.
The number of models that are currently running in an ModelOp Runtime
The number of model tests that have failed
The number of those failures that are errors in the model as opposed to system or MLC errors
You can click on a category that is populated to filter the notifications to see details related to that category. For instance, if Test Failures shows the number 2, you can click on the number to filter the notifications below to just those associated with test failures.
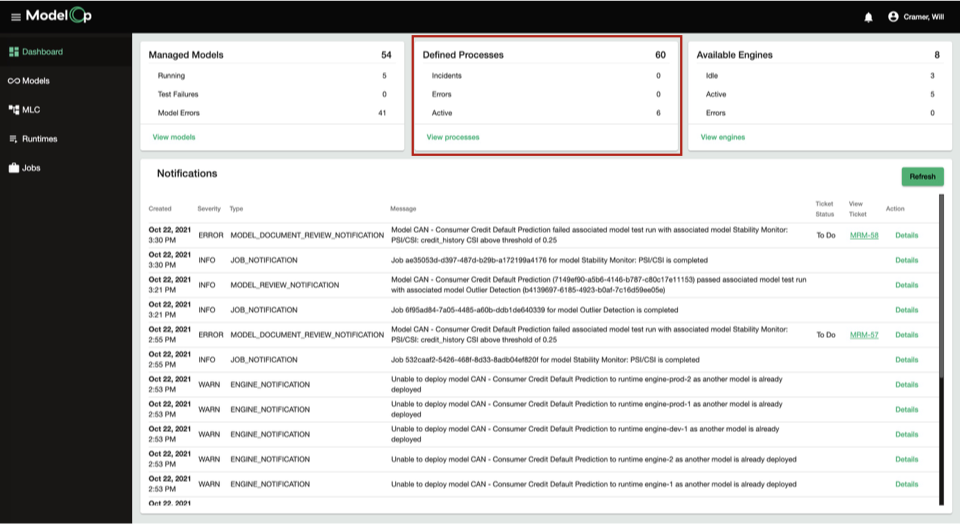
Processes Pane
The Processes pane displays how many MLC processes are currently deployed and any incidents or errors associated with the MLC processes.
The MLC Processes
Each MLC Process has built in monitoring tasks that report events and errors to the Command Center. This pane displays the following:
The number of defined MLC Processes
The number of reported incidents
The number of active MLC Processes
The number of MLC Process errors
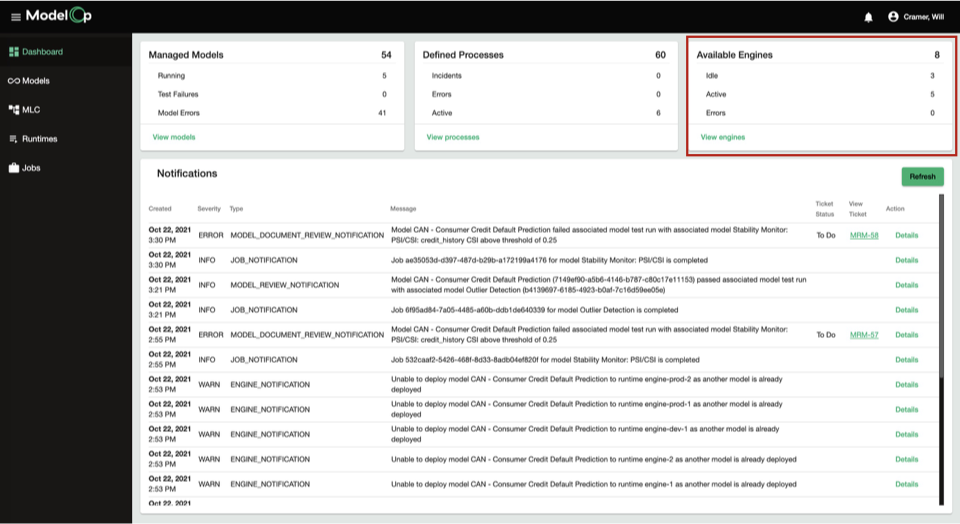
Runtimes Pane
The Runtimes pane displays information about the runtimes available to the system. These are the model execution environments (“runtimes”) where models are deployed.
This pane displays how many runtimes are available, which runtimes are active vs. idle, and if there are any runtime errors.
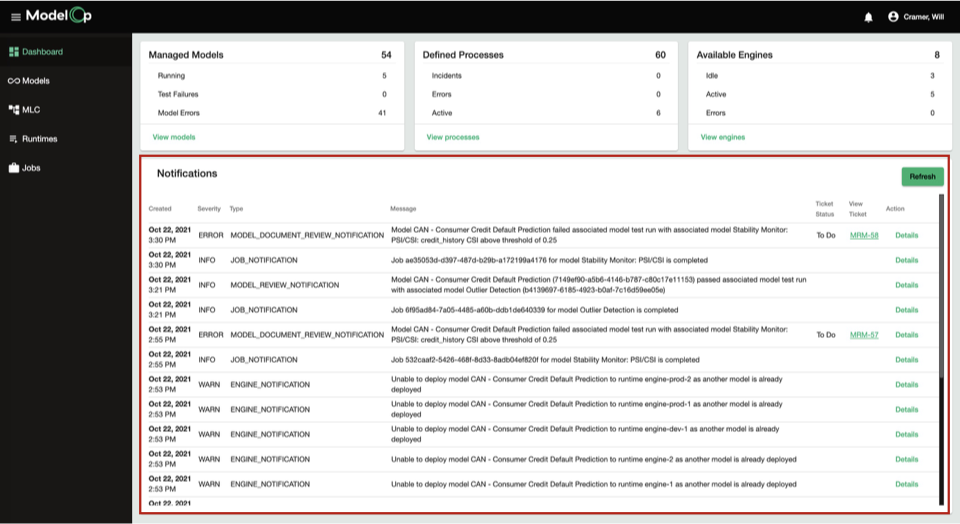
Notifications Pane
The notifications pane displays a real-time list of all notifications across the ModelOp Center system. This includes informational notifications as well as alerts that require immediate attention. Per the prior sections, the notifications pane can be filtered by clicking one of the items in the Models, Processes, or Runtimes pane.
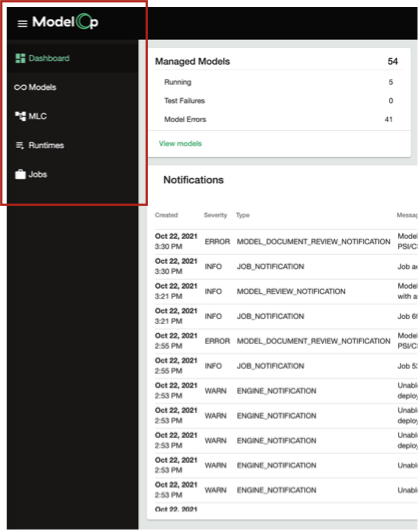
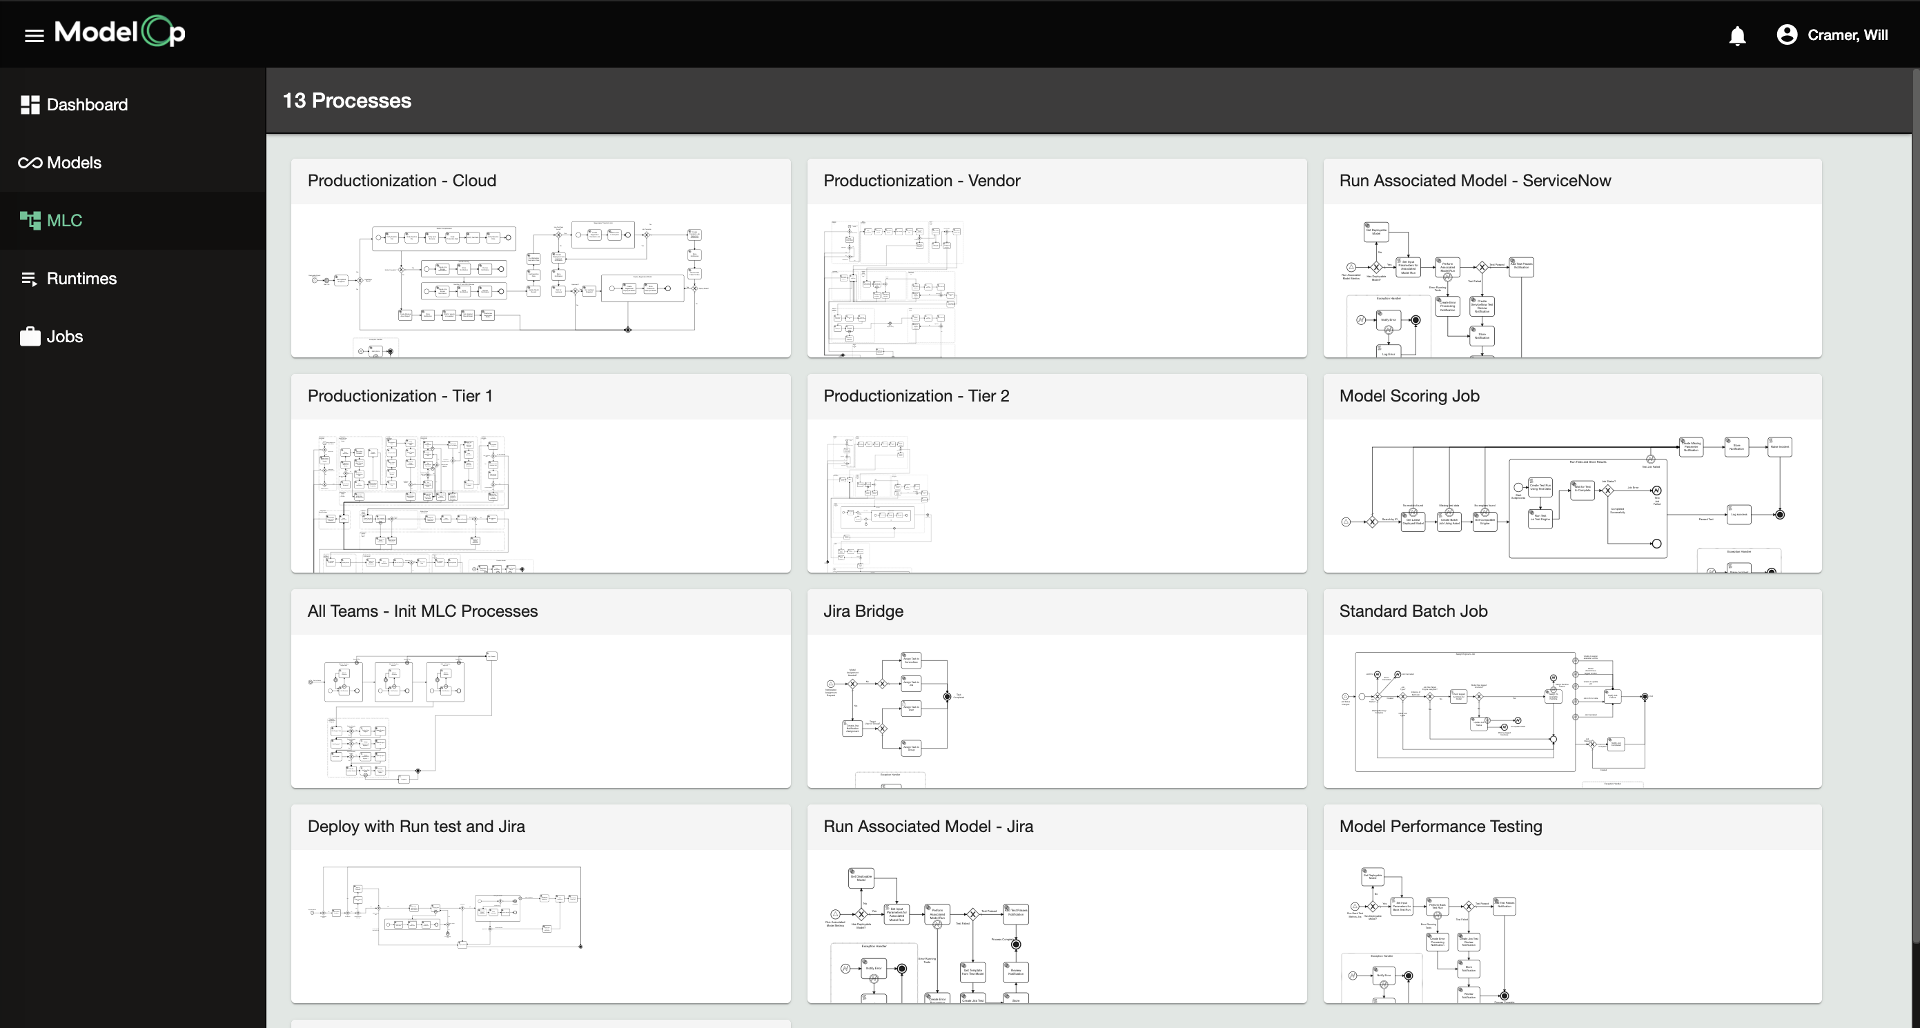
Main Menu Bar
The Main Menu Bar is meant to provide quick access to all of the Models, MLC Processes, Runtimes, and Jobs across the enterprise ModelOps program. See below for details of each section.
Production Model Inventory
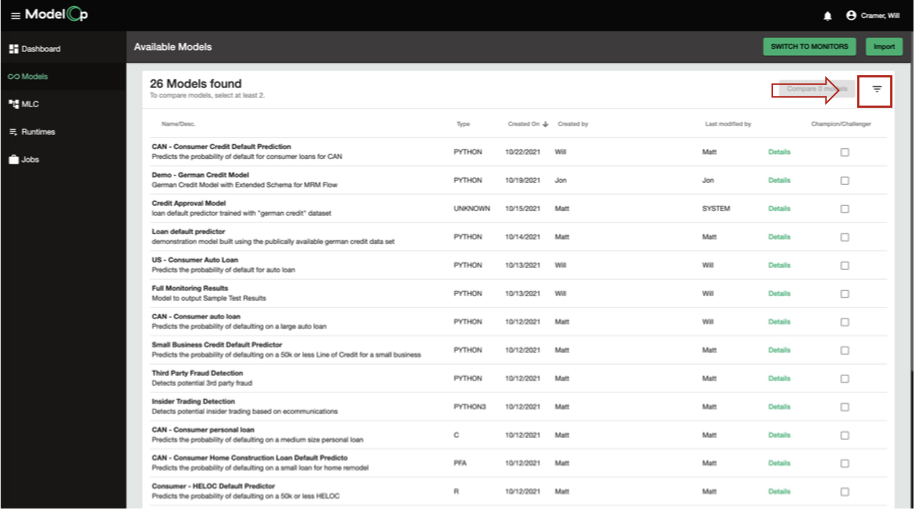
Clicking the “Models” menu item opens the Production Model Inventory (sometimes referred by others as “Production Model Catalog”). The production model inventory contains the full list of registered models within ModelOp Center, regardless of the model type, model factory in which it was produced, current state of the model (registered vs. in QA vs. deployed).

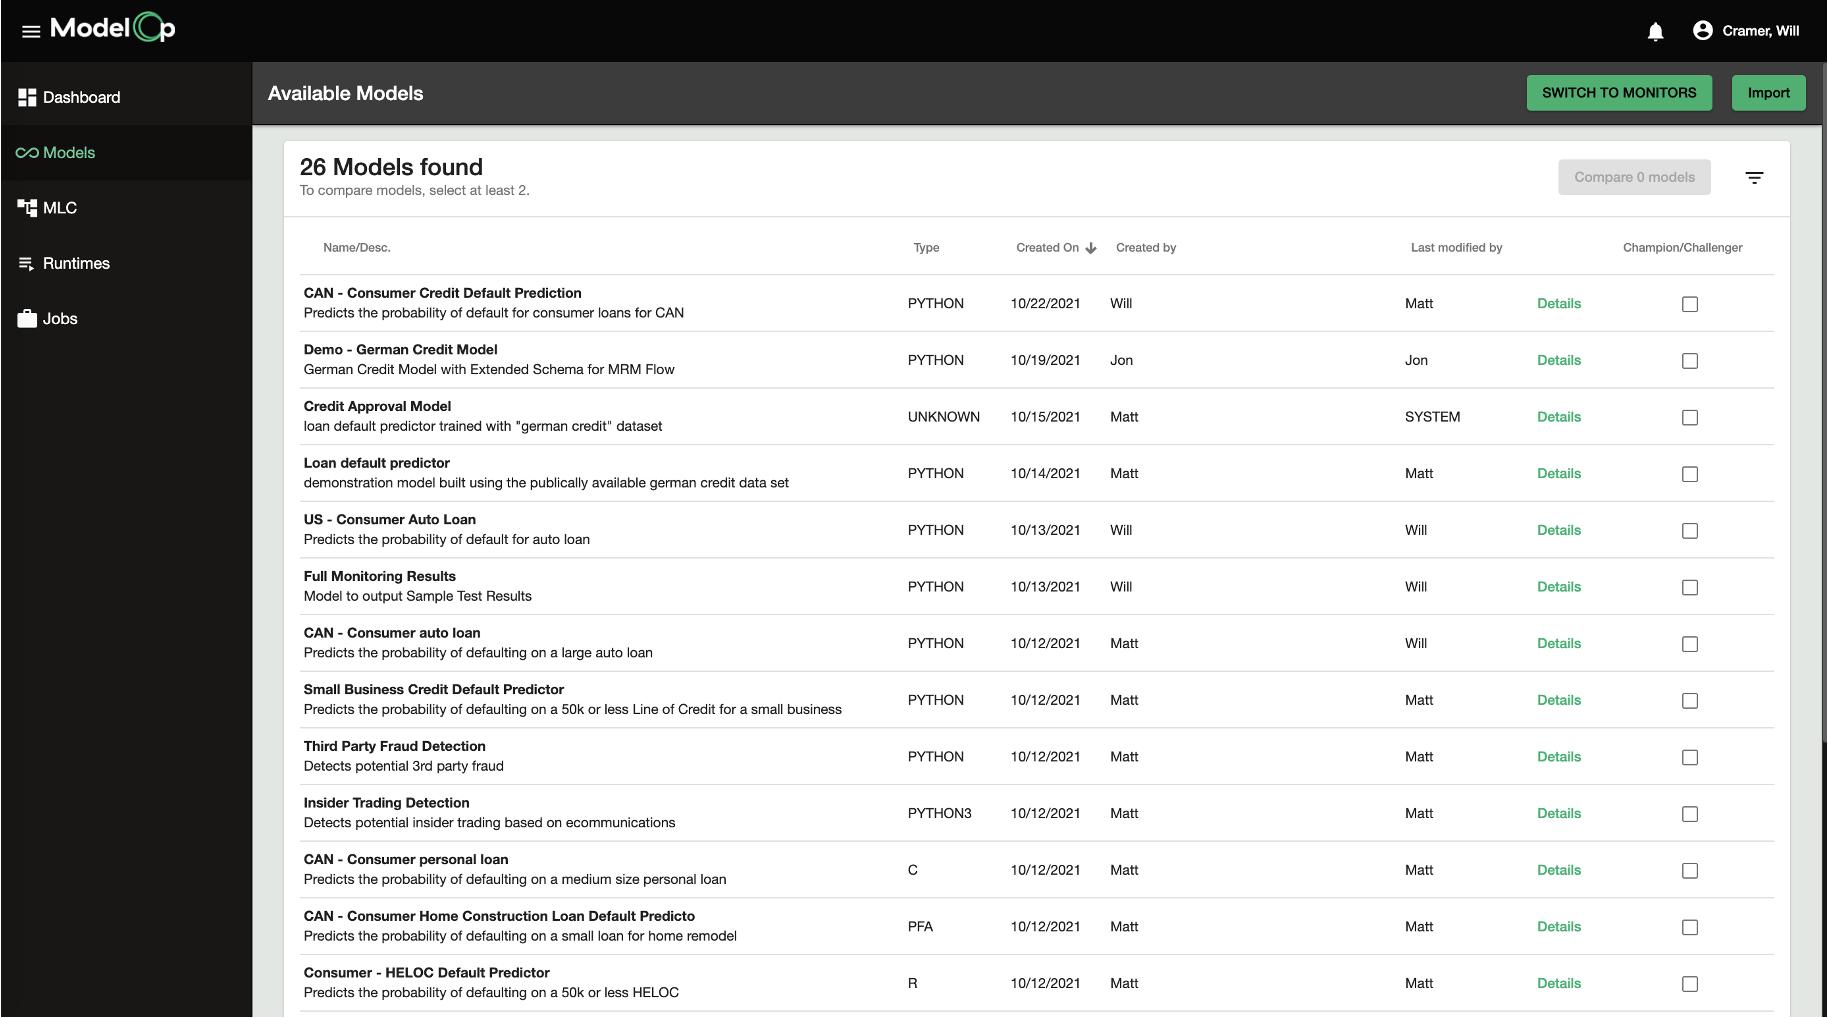
A user may search for a model by Name or Tag by clicking the Search icon in the top right:
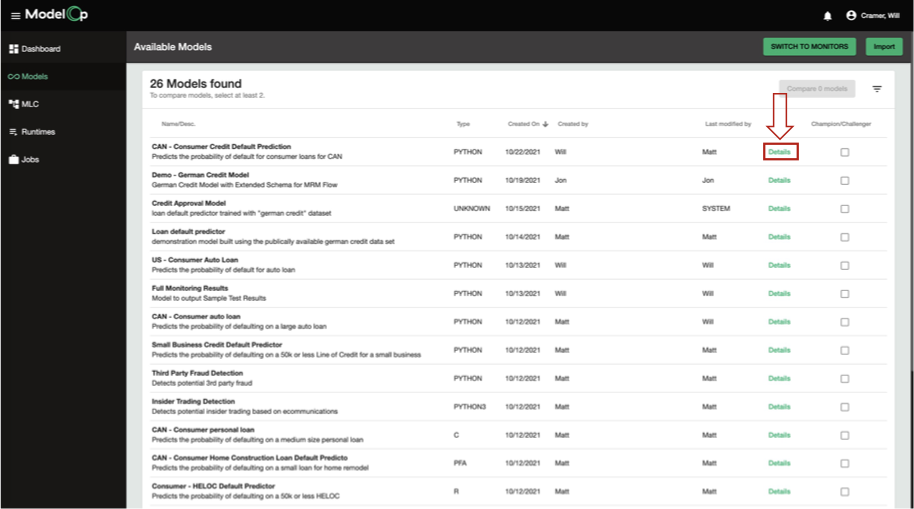
A user may click on the “Details” link for a model within to view the specific details of that model (see subsequent “Model Details” page):
Additionally, a user may select to compare two models using the “Champion/Challenger” radio buttons. Champion/Challenger is an industry standard technique to compare the performance of competing model strategies, or the performance of a recently updated model against a previous version of the same model.
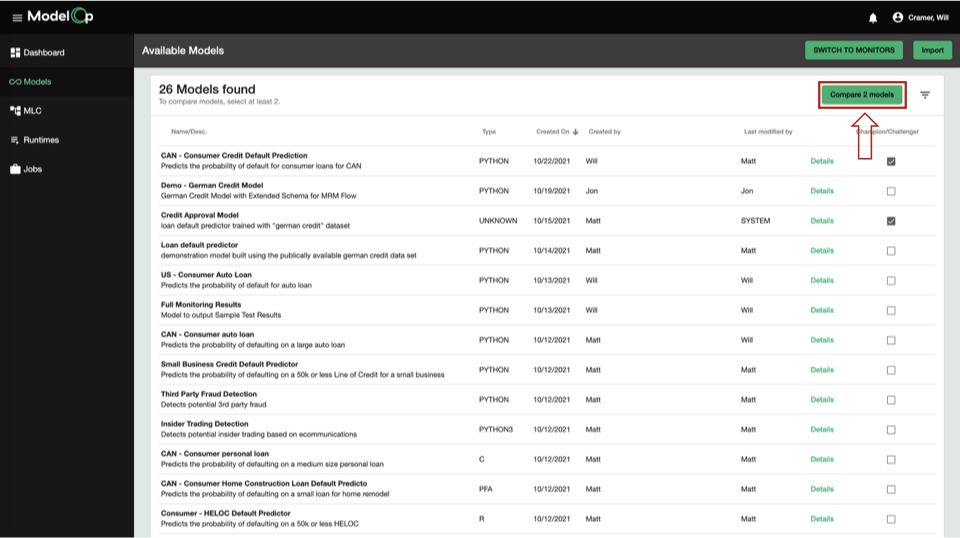
See the Champion/Challenger article for more details.
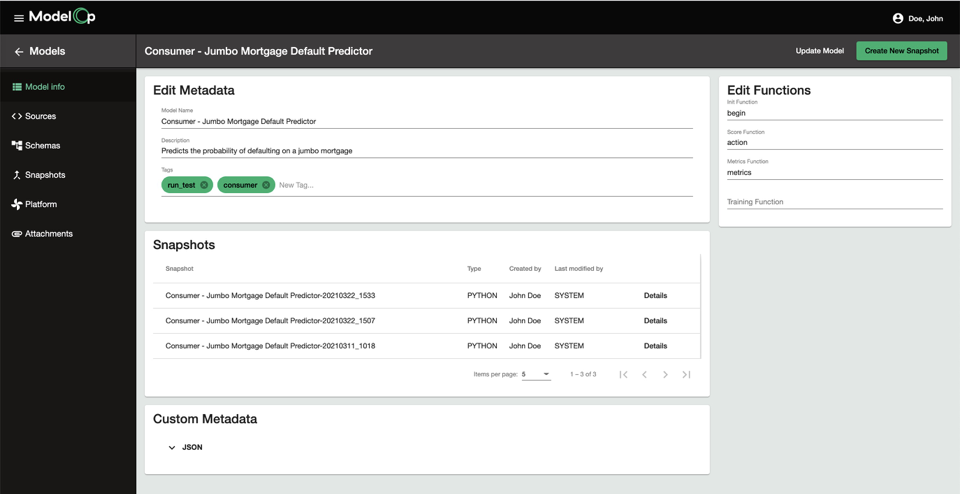
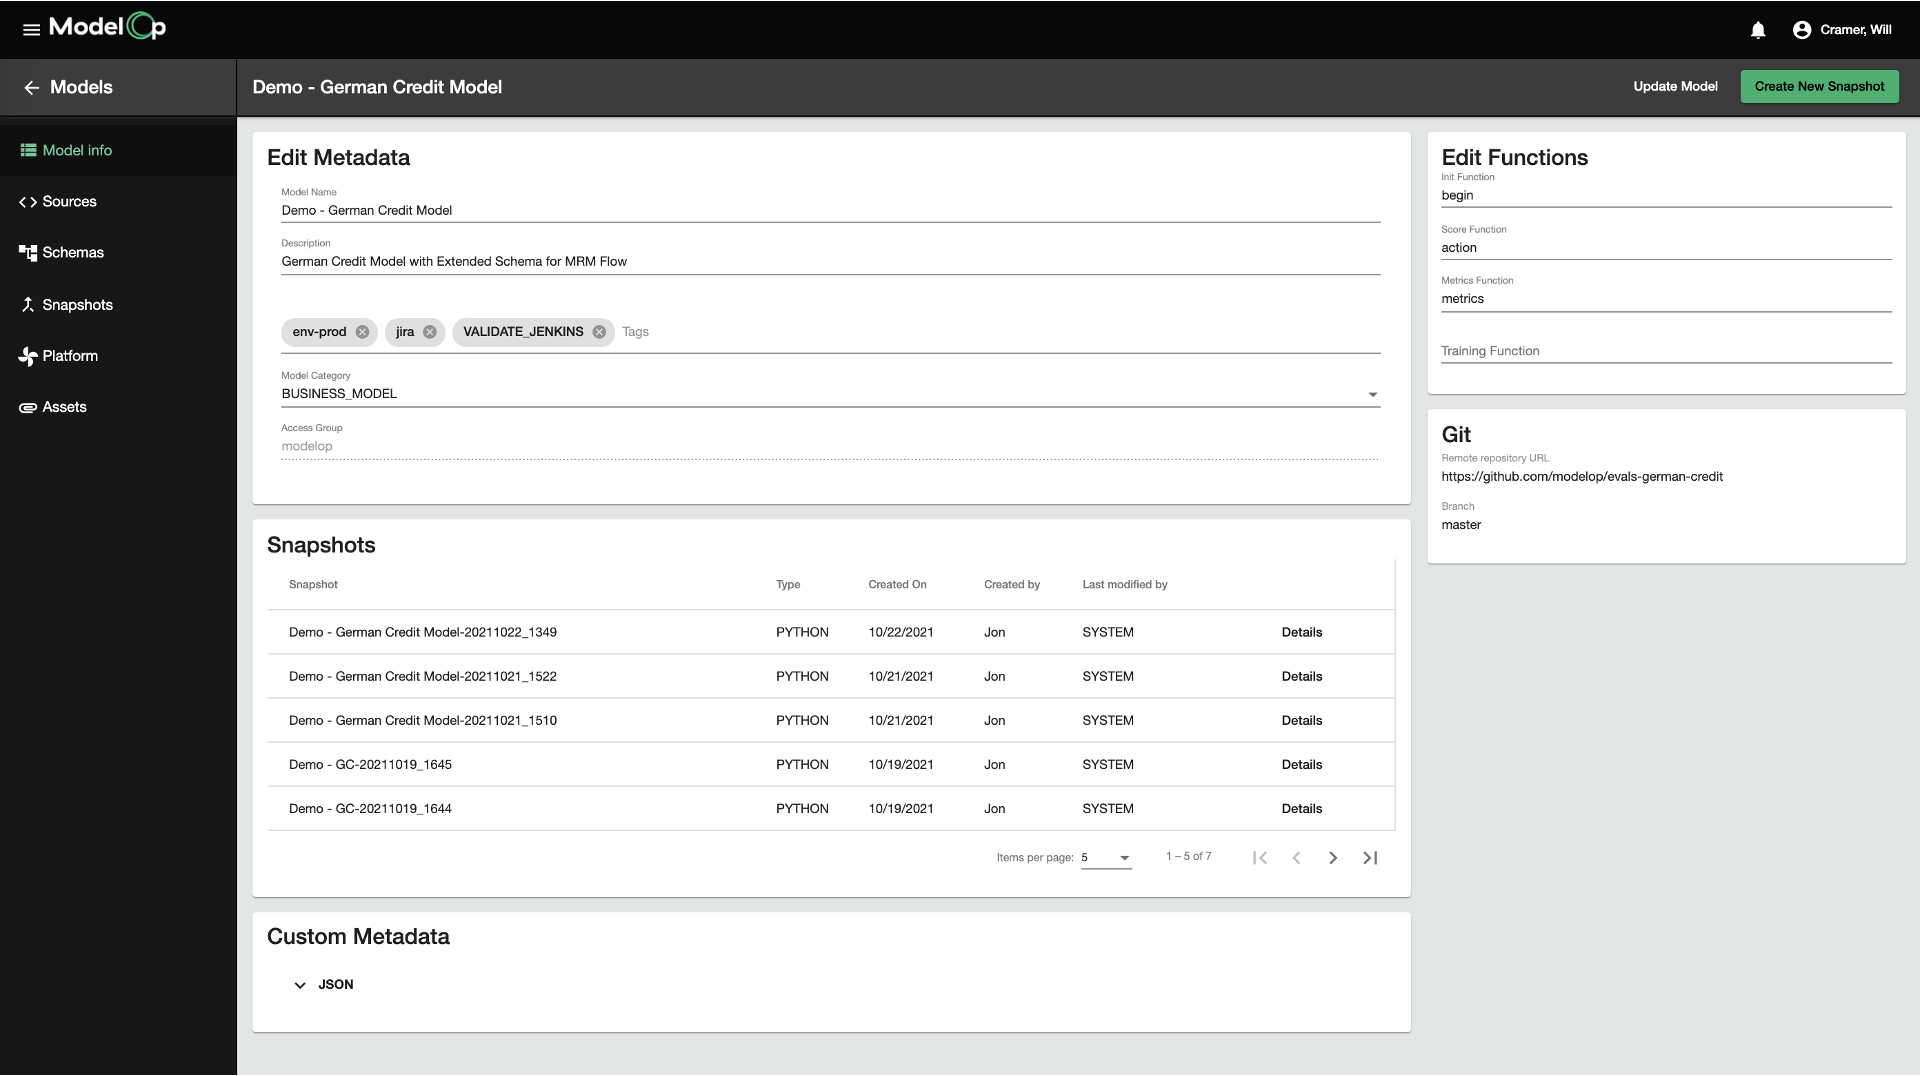
Model Details
The Model Details page provides all of the metadata, technical model details, version information, MLC’s, and test results related to a given model. The following table describes the information available under the Model Details page
Model Info |
|
Model Source | Provides details of all the source code assets, typically stored in a git repository. |
Schemas | Defines the input and output schemas to which the input data and output inferences must adhere as part of model execution. The schemas use the well-adopted Avro standard to enable a contract between the data ingress / egress and the model code. |
Snapshots | Lists all snapshots (“versions”) of the model, the type, last modification date, last modifier, and a URL to view the Version details |
Platform | Lists the dependencies used by the model, both system and framework-specific libraries/frameworks. |
Attachments | Attachments are other model artifacts used during the life cycle of a model, including items such as training model coefficients/binaries, documents, test data references, or other items. |
Model Life Cycle (MLC) Dashboard
Clicking the “MLC” main menu item opens the MLC Dashboard, which displays all of the MLC Processes (bpmn’s) that are currently deployed into the MLC Manager:
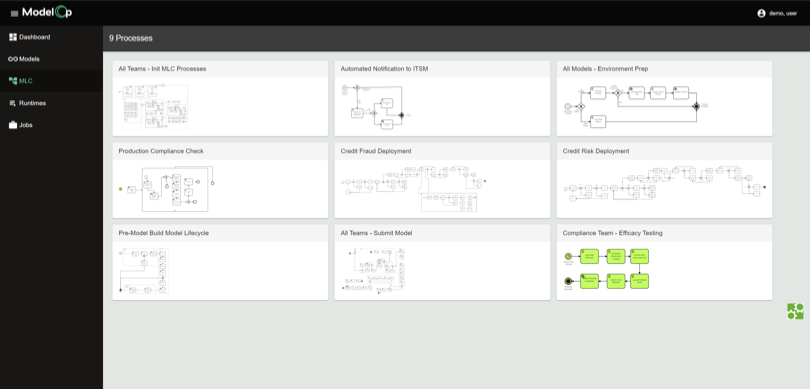
As processes run, the activities within a given process are highlighted in green (see picture above).
A user may choose to open a given MLC to view more details about the process by simply clicking one of the MLC “tiles”. This navigates the user to the MLC Details page.
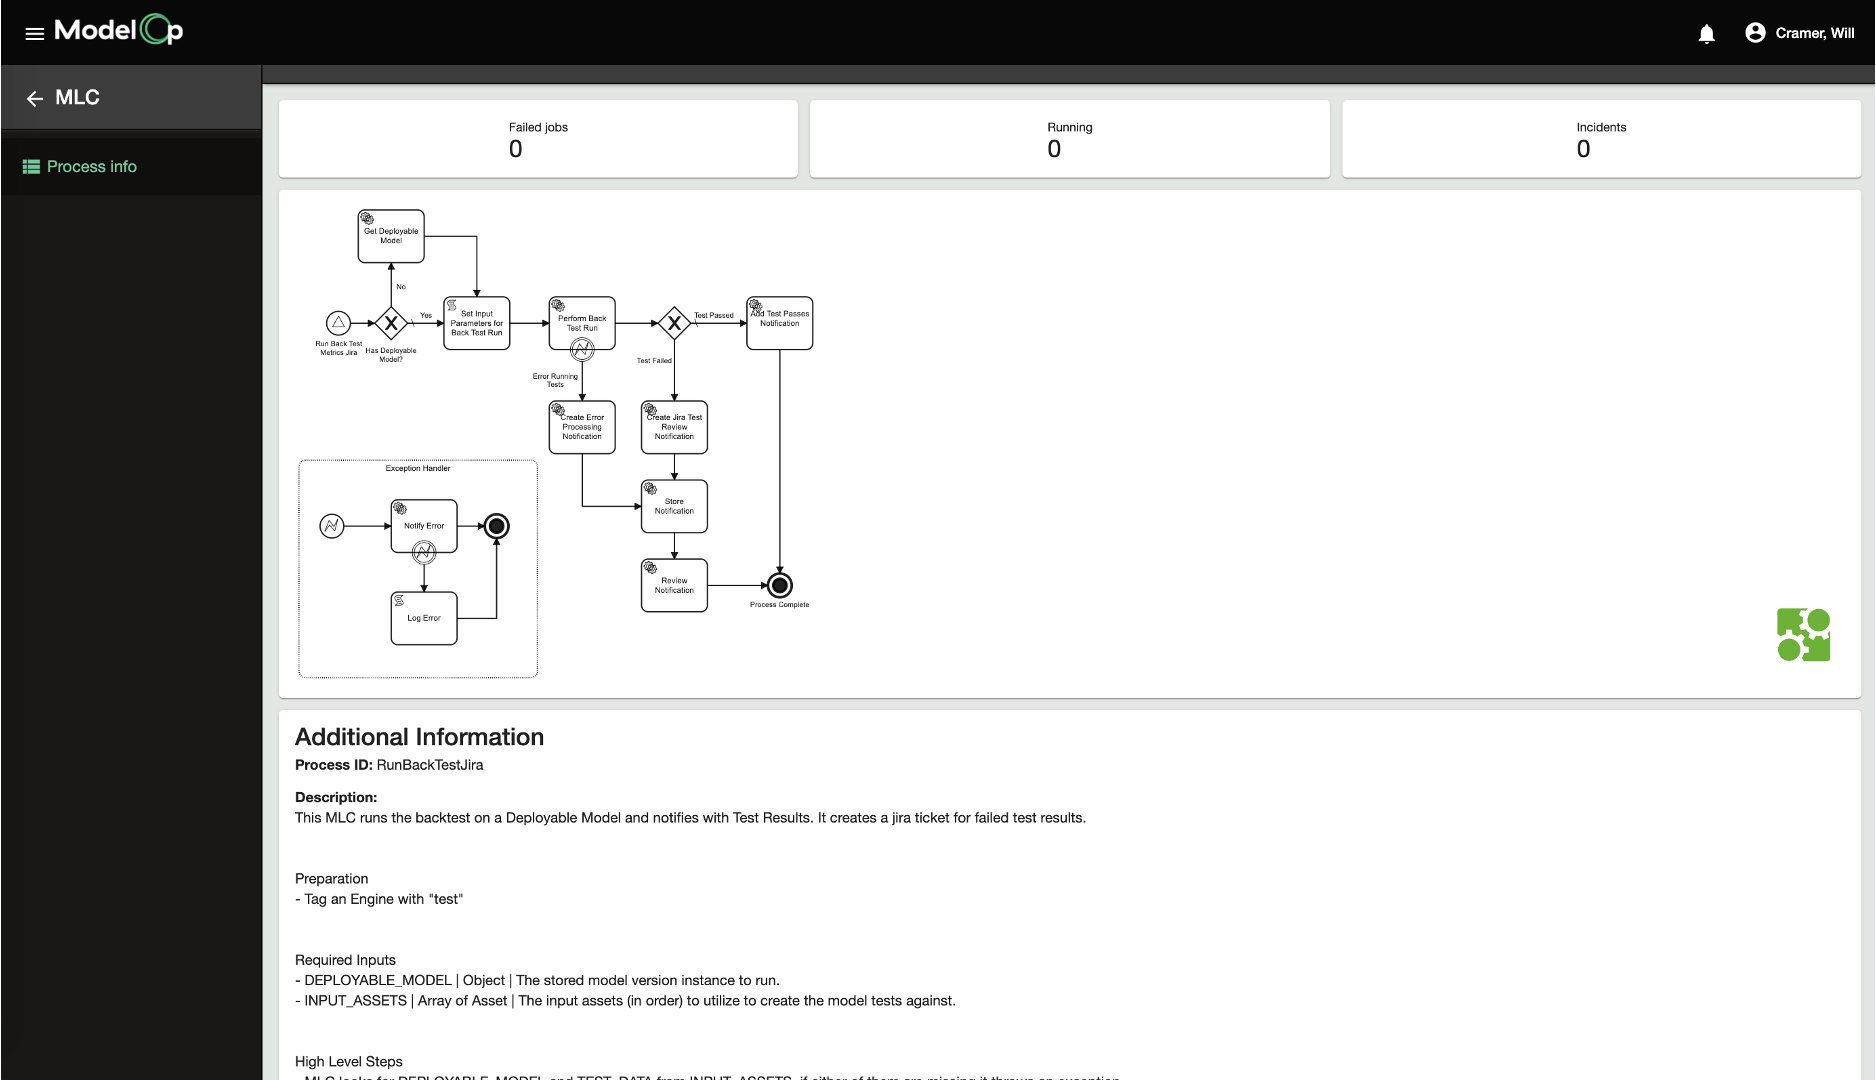
Model Life Cycle (MLC) Details
The MLC Details page provides an overview of a given MLC process.
This includes:
Information about failed activities/jobs, currently running process instances, and process instance incidents.
The actual MLC process diagram itself. Note that, as a process instance runs, the activities within a given process are highlighted in green.
MLC statistics about how long--on average--a given step in this MLC takes to execute.
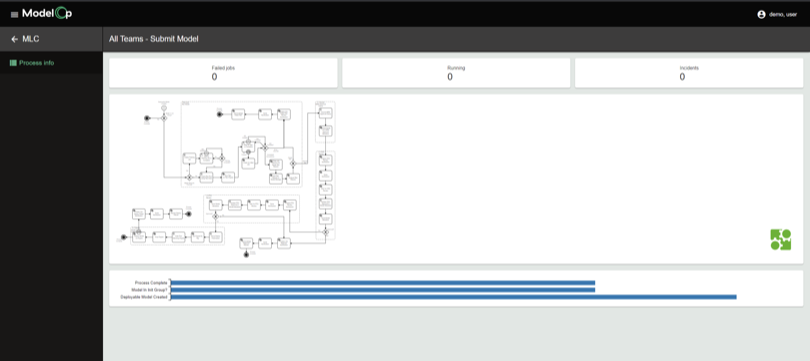
A detailed description about the MLC, including input, outputs, exception handling, and version information
Runtimes Dashboard
The Runtimes Dashboard shows all of the Runtimes that have been registered and are being managed by ModelOp Center. Note that Runtimes can consist of ModelOp Runtimes, or they can be “external” Runtimes, such as a Spark or DataIku AWS SageMaker runtime.
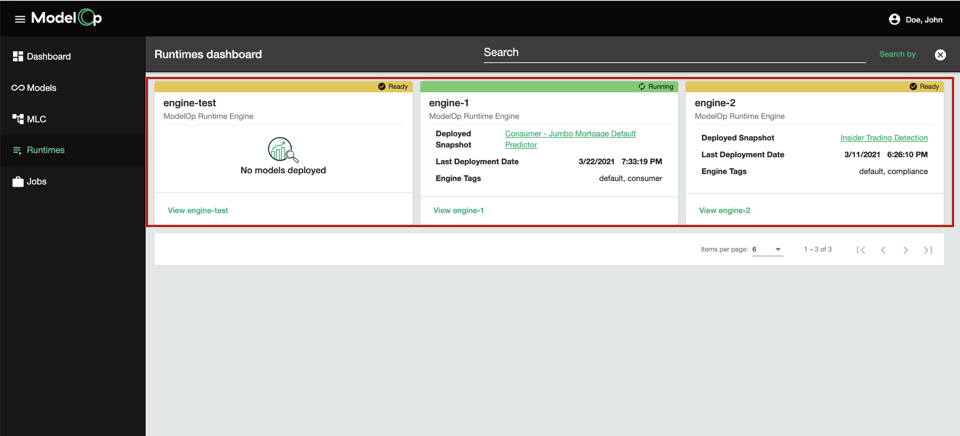
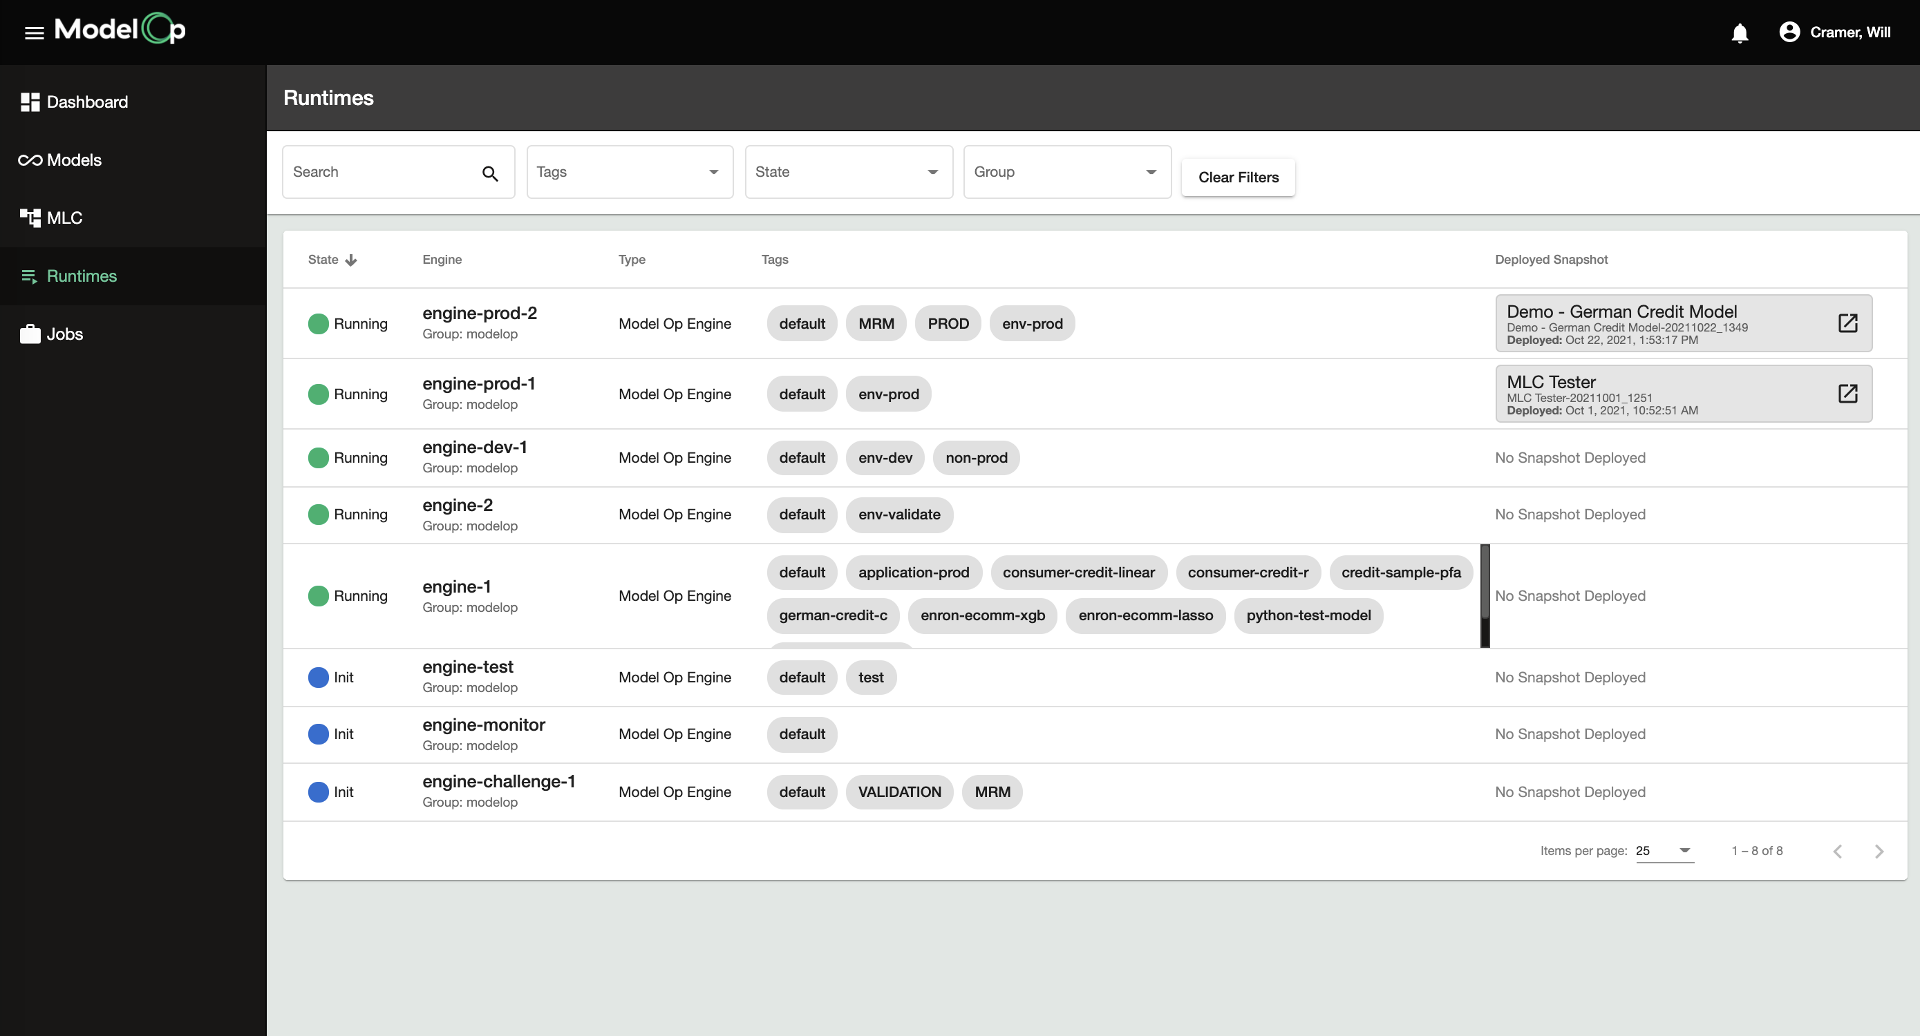
For each Runtime, the following information is displayed:
Current State | The current state of a Runtime (e.g. Model is deployed and “running”, ready for a model to be deployed, in error state, etc.) | ||
Runtime Name | The provided name of the Runtime. For the ModelOp Runtime, this is configurable upon Runtime provisioning. | ||
Runtime Type | The type of Runtime (e.g. ModelOp Runtime, DataIku Runtime) | ||
Current State | The current state of a Runtime (e.g. Model is deployed and “running”, ready for a model to be deployed, in error state, etc.)Runtime Tags | Any tags associated with the Runtime | |
If a Model is Deployed: |
| Runtime Details |
|
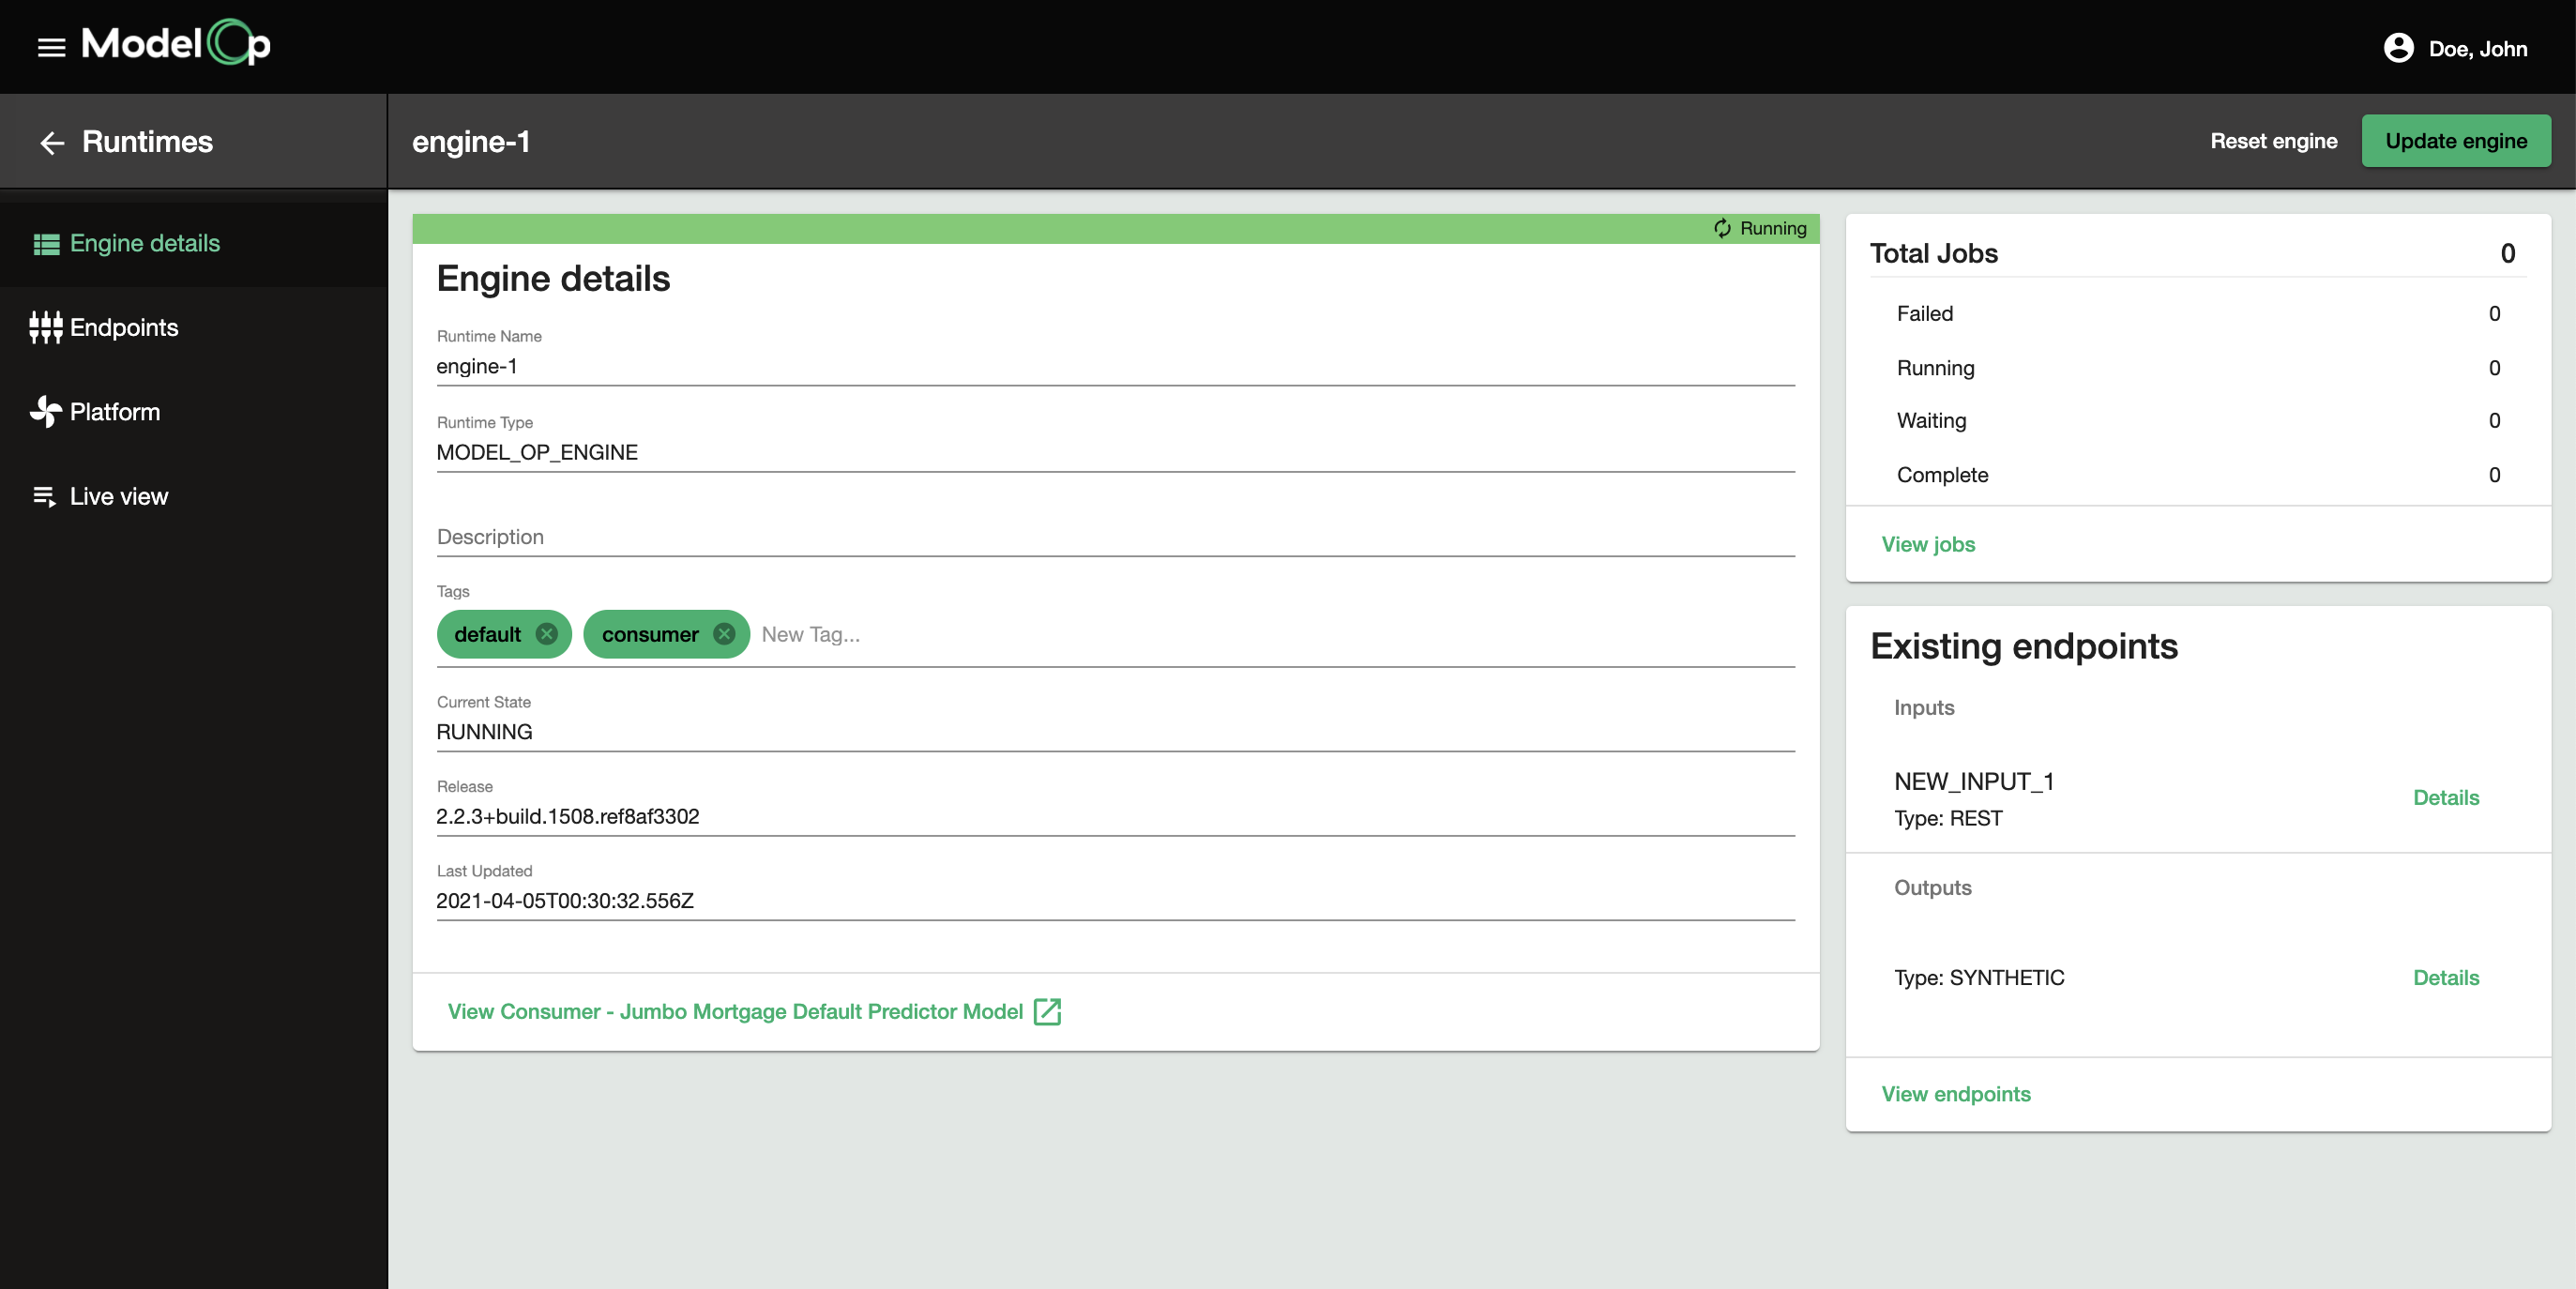
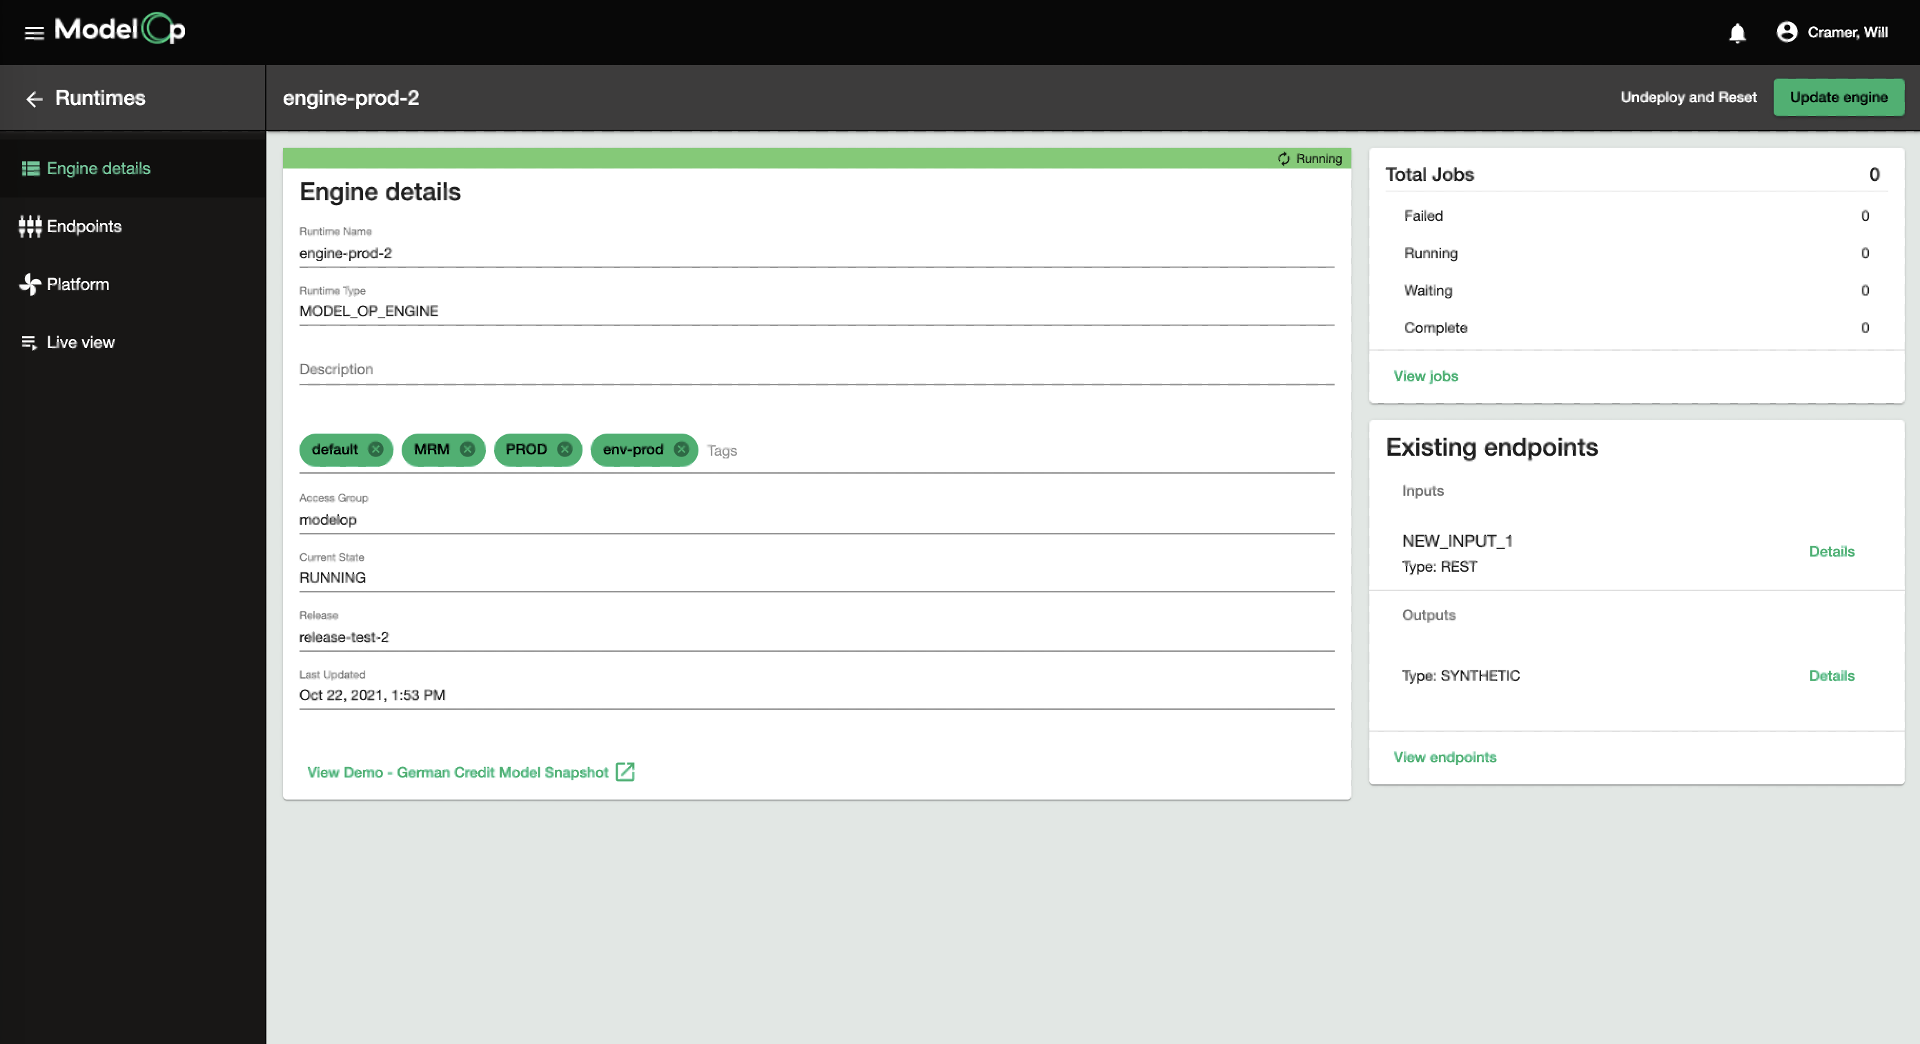
Runtime Details
The Runtime Details page provides information about the current status, configuration, and deployment details for a particular runtime.
This includes:
“Engine” Details tab :
Engine Details - displays the name, description and type of the runtime, identifying tags, its current state, release number, and when it was last updated
URL to the Deployed Model - displays information about the model that is currently deployed on the runtime, if applicable
Total Jobs - information about jobs that have been executed on the Runtime
Existing Endpoints - list of existing input and output endpoints that have been configured for the Runtime
Endpoints tab: lists assigned input and output endpoints. Authorized users can also add new input and output endpoints on this screen.
Platform tab: platform information including system and framework-specific libraries installed on the Runtime
Live View tab: live statistics and details about the endpoint throughput, CPU utilization, and system resource usage