Introduction
Monitoring a model for its goodness-of-fit performance is necessary to track whether the model is producing good output (inferences/scores) as compared to actual ground truth. These performance metrics provide excellent insight into the predictive power of the model, including helping to identify degradation in the model’s ability to predict correctly. These performance monitors should be run routinely against batches of labeled data and compared against the original metrics produced during training to ensure that the model is performing within specification. If the production performance metrics deviate beyond a set threshold, then the appropriate alerts are raised for the data scientist or ModelOps engineer to investigate.
ModelOp Center provides performance monitors out-of-the-box (OOTB) but also allows you to write your own custom metrics to monitor the statistical performance of the model. The subsequent sections describe how to add a performance monitor - assuming an OOTB monitor - and the detailed makeup of a performance monitor for multiple types of models.
Adding Performance Monitors
As background on the terminology and concepts used below, please read the Monitoring Concepts section of the Model overview documentation.
To add performance monitoring to your business model, you will add an existing “Monitor” to a snapshot (deployable model) of the business model under consideration. Below are the steps to accomplish this. For tutorial purposes, these instructions use all out-of-the-box and publicly available content provided by ModelOp, focusing on the German Credit Model and its related assets.
Associate a Monitor to a Snapshot of a Business Model
In MOC, navigate to the business model to be monitored. In our case, that’s the German Credit Model.
Navigate to the specific snapshot of the business model. If no snapshots exist, create one.
On the Monitoring tab, click on
+ Add, then click onMonitor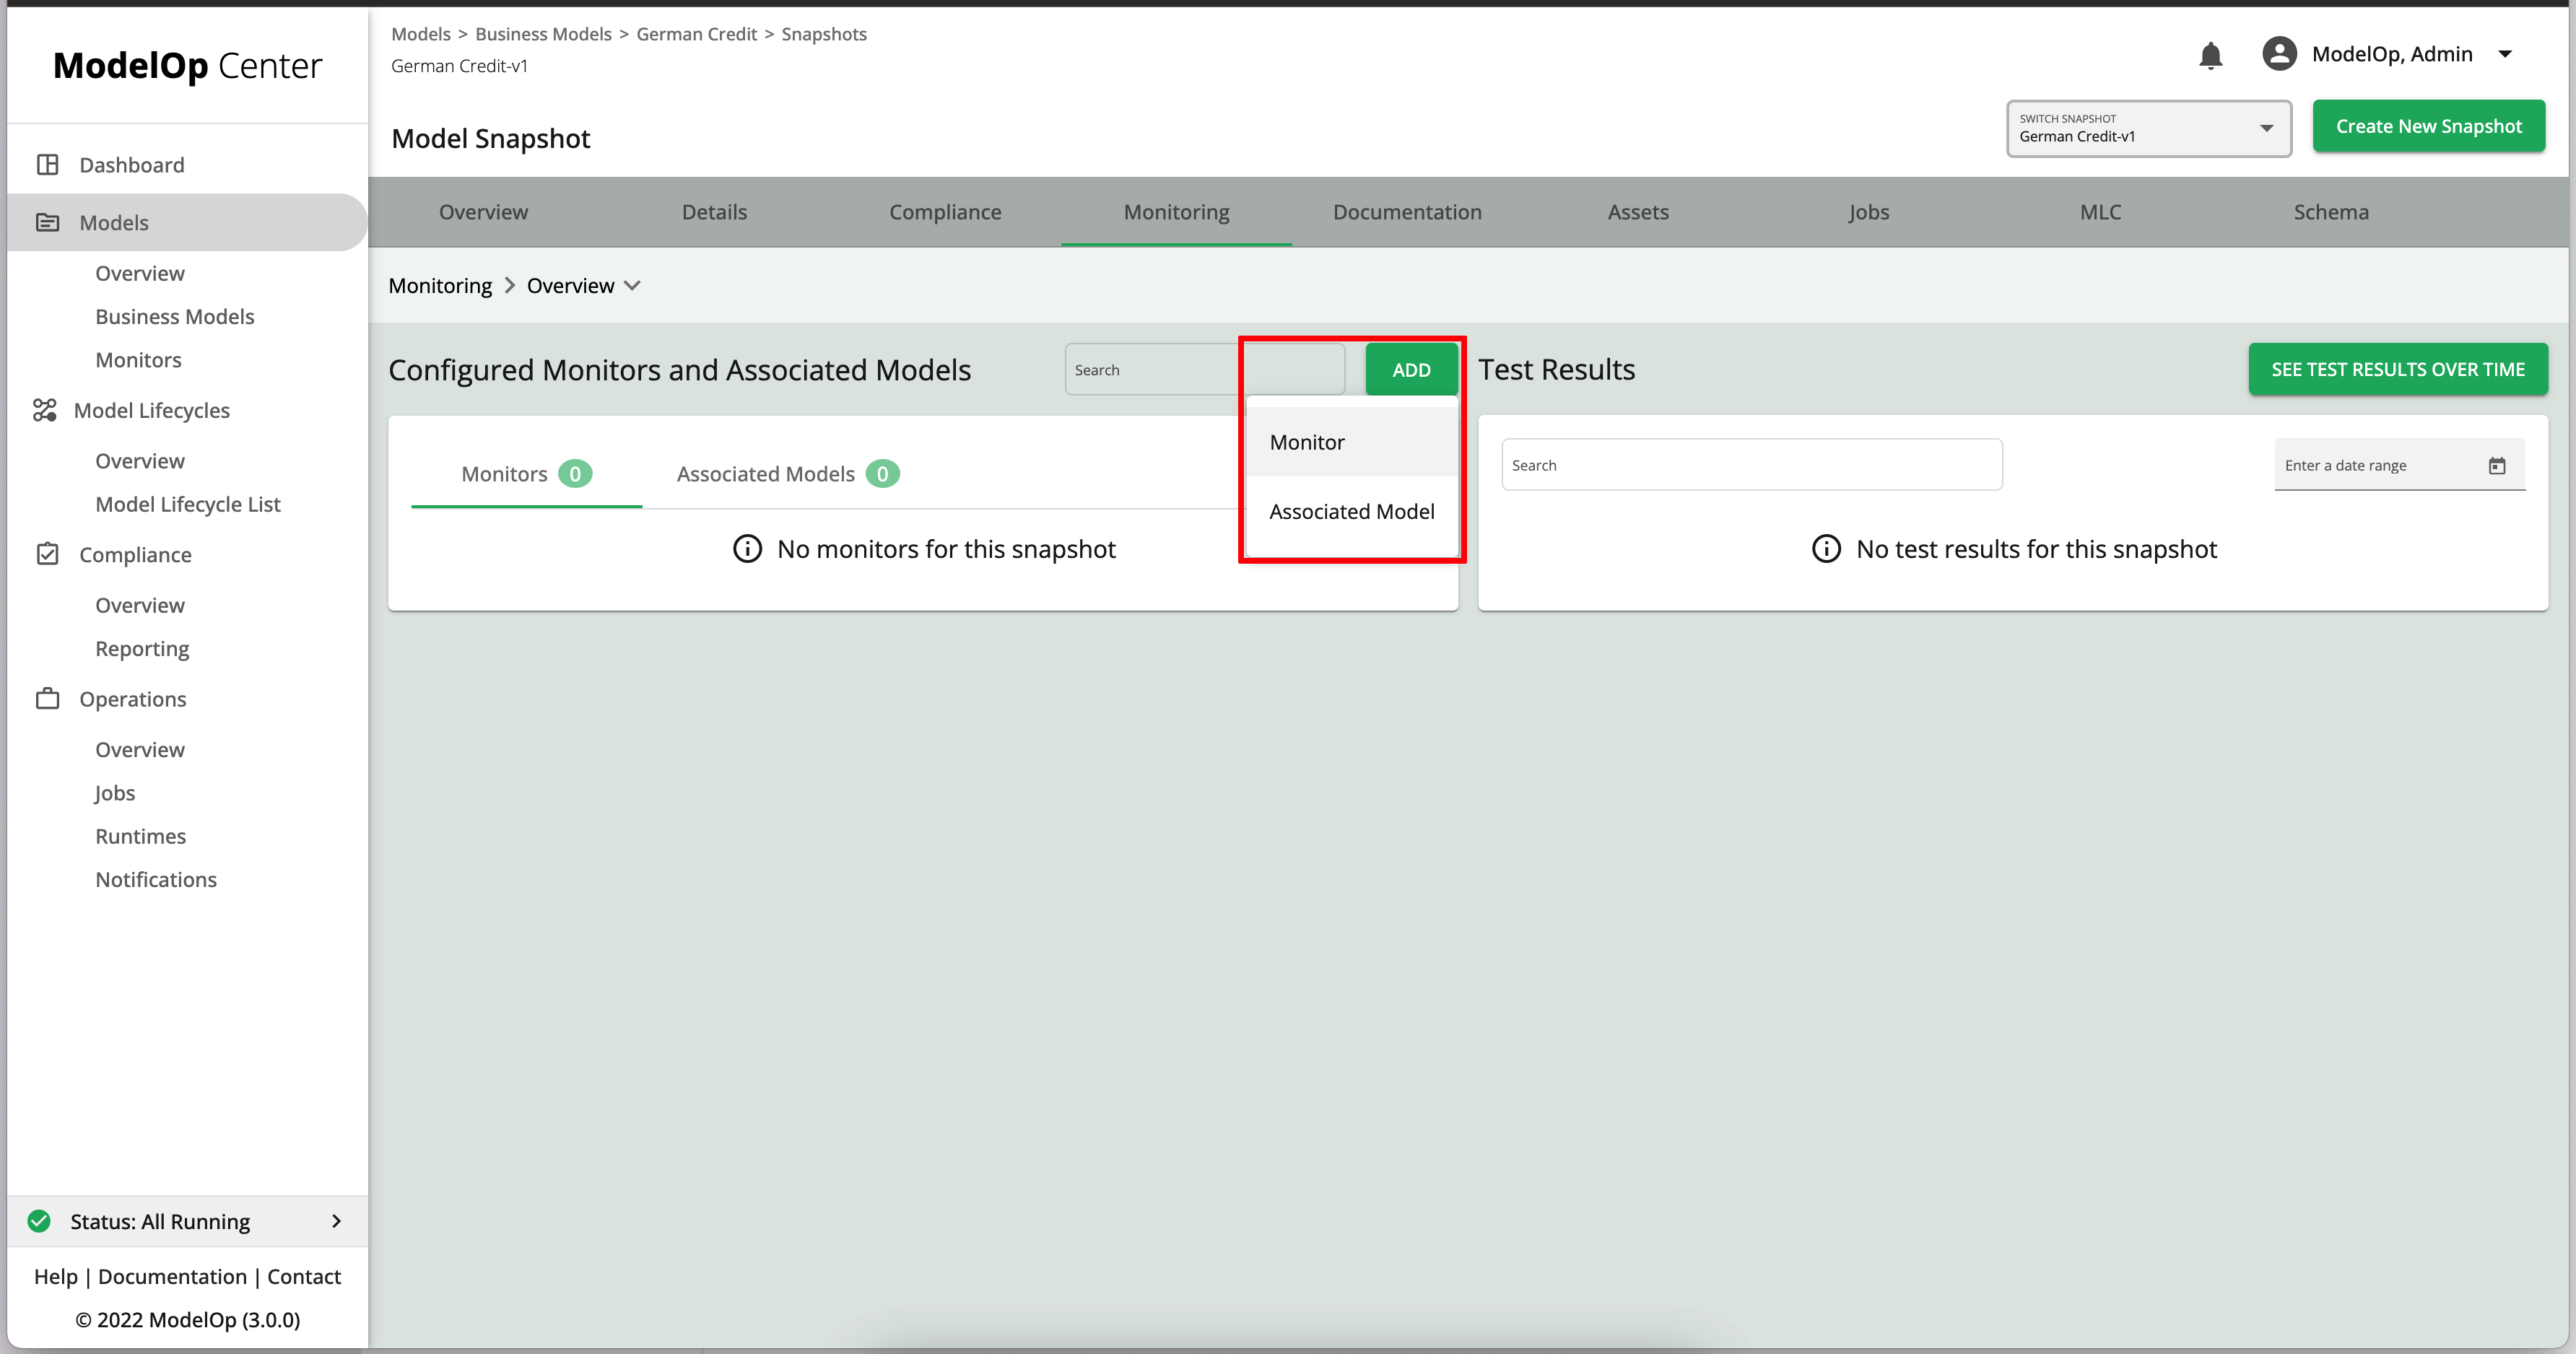
Search for (or select) the
Performance Monitor: Classification Metricsfrom the list of OOTB monitors.Select a snapshot of the monitor. By default, a snapshot is created for each OOTB monitor
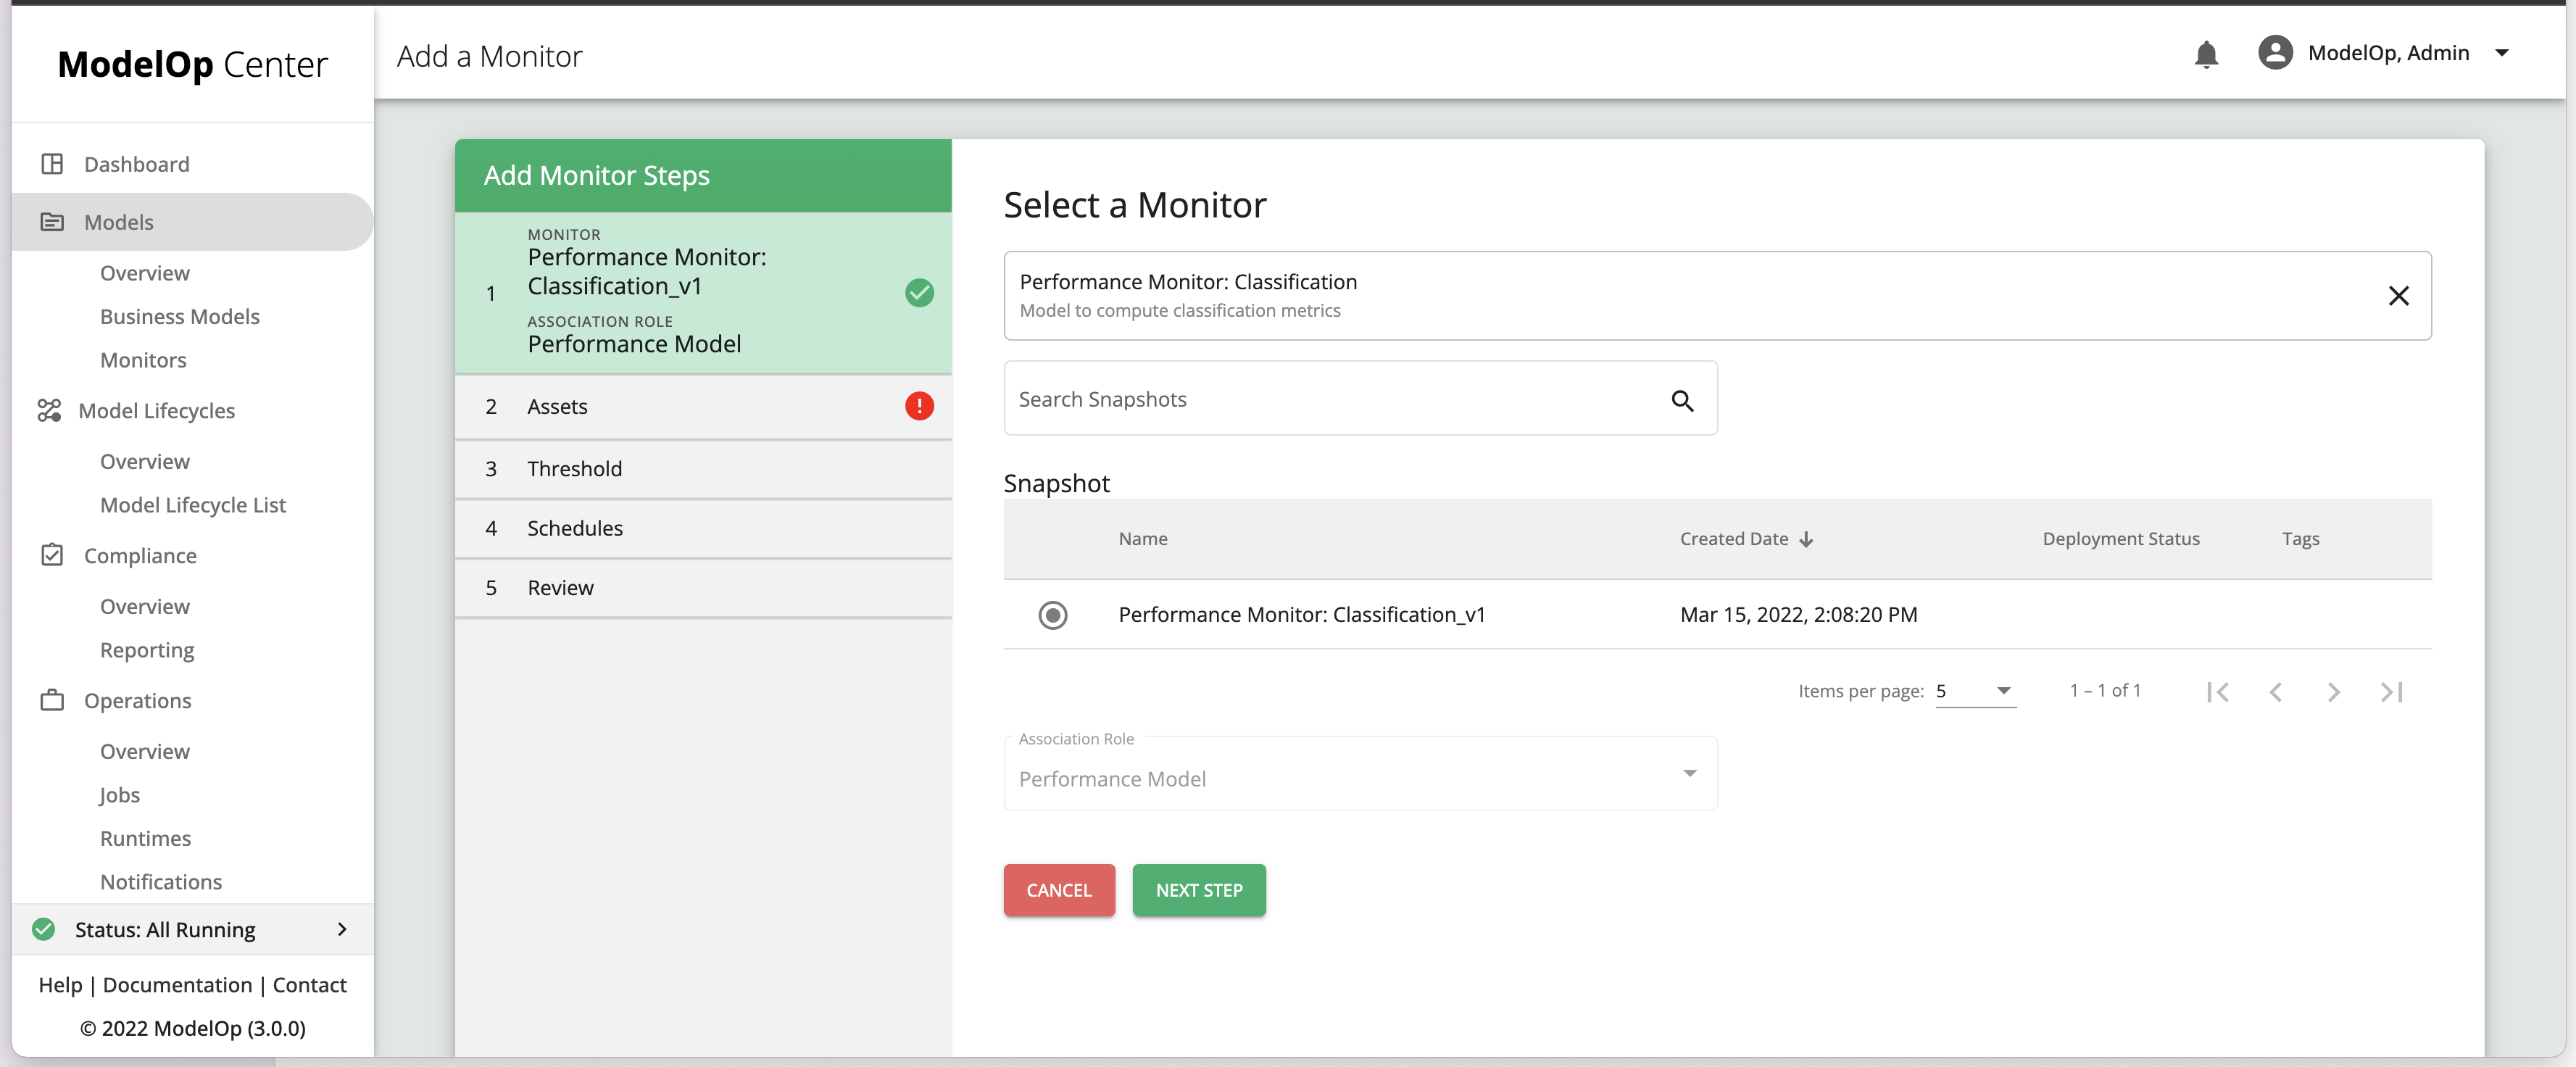
On the
Input Assetspage, you’ll notice that the only asset that is required is sample data. This is because a performance monitor computes metrics on 1 dataset only, and thus does not do a comparison to a baseline/reference dataset. For our example, selectdf_sample_scored.jsonas theSample Data Asset. Since the file is already an asset of the business model, we can find it underSelect Existing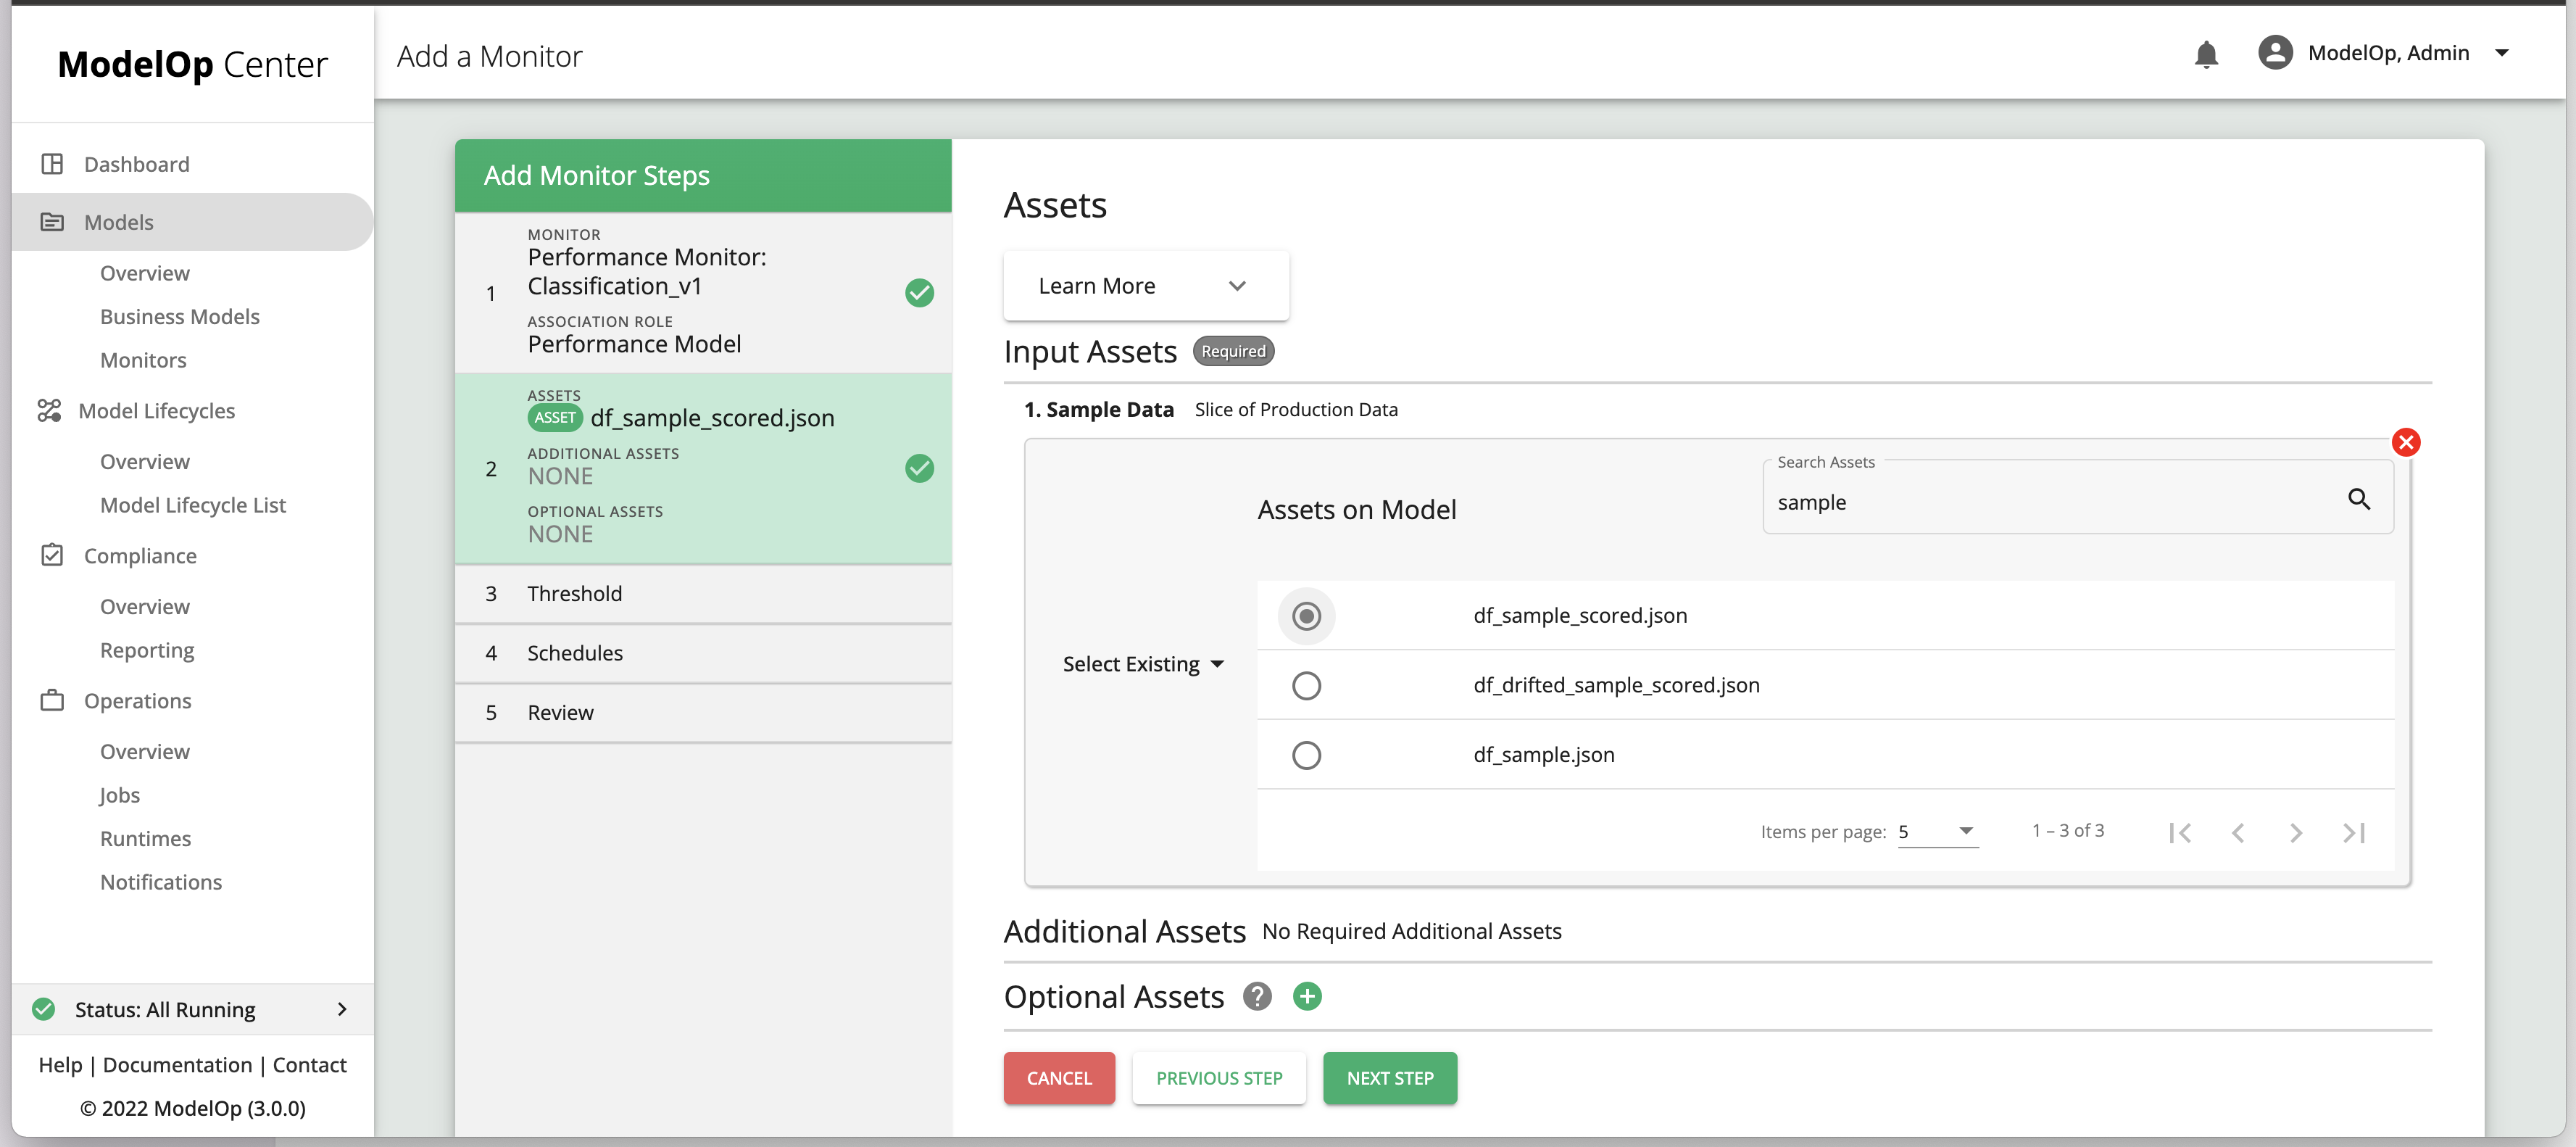
On the
Thresholdpage, click onADD A THRESHOLD, then select the.dmnfileperformance_classification_DMN.dmn. Since the file is already an asset of the business model, we can find it underSelect Existing. If the business model does not have a.dmnasset, the user may upload on from a local directory during the monitor association process. More on thresholds and decision tables in the next section.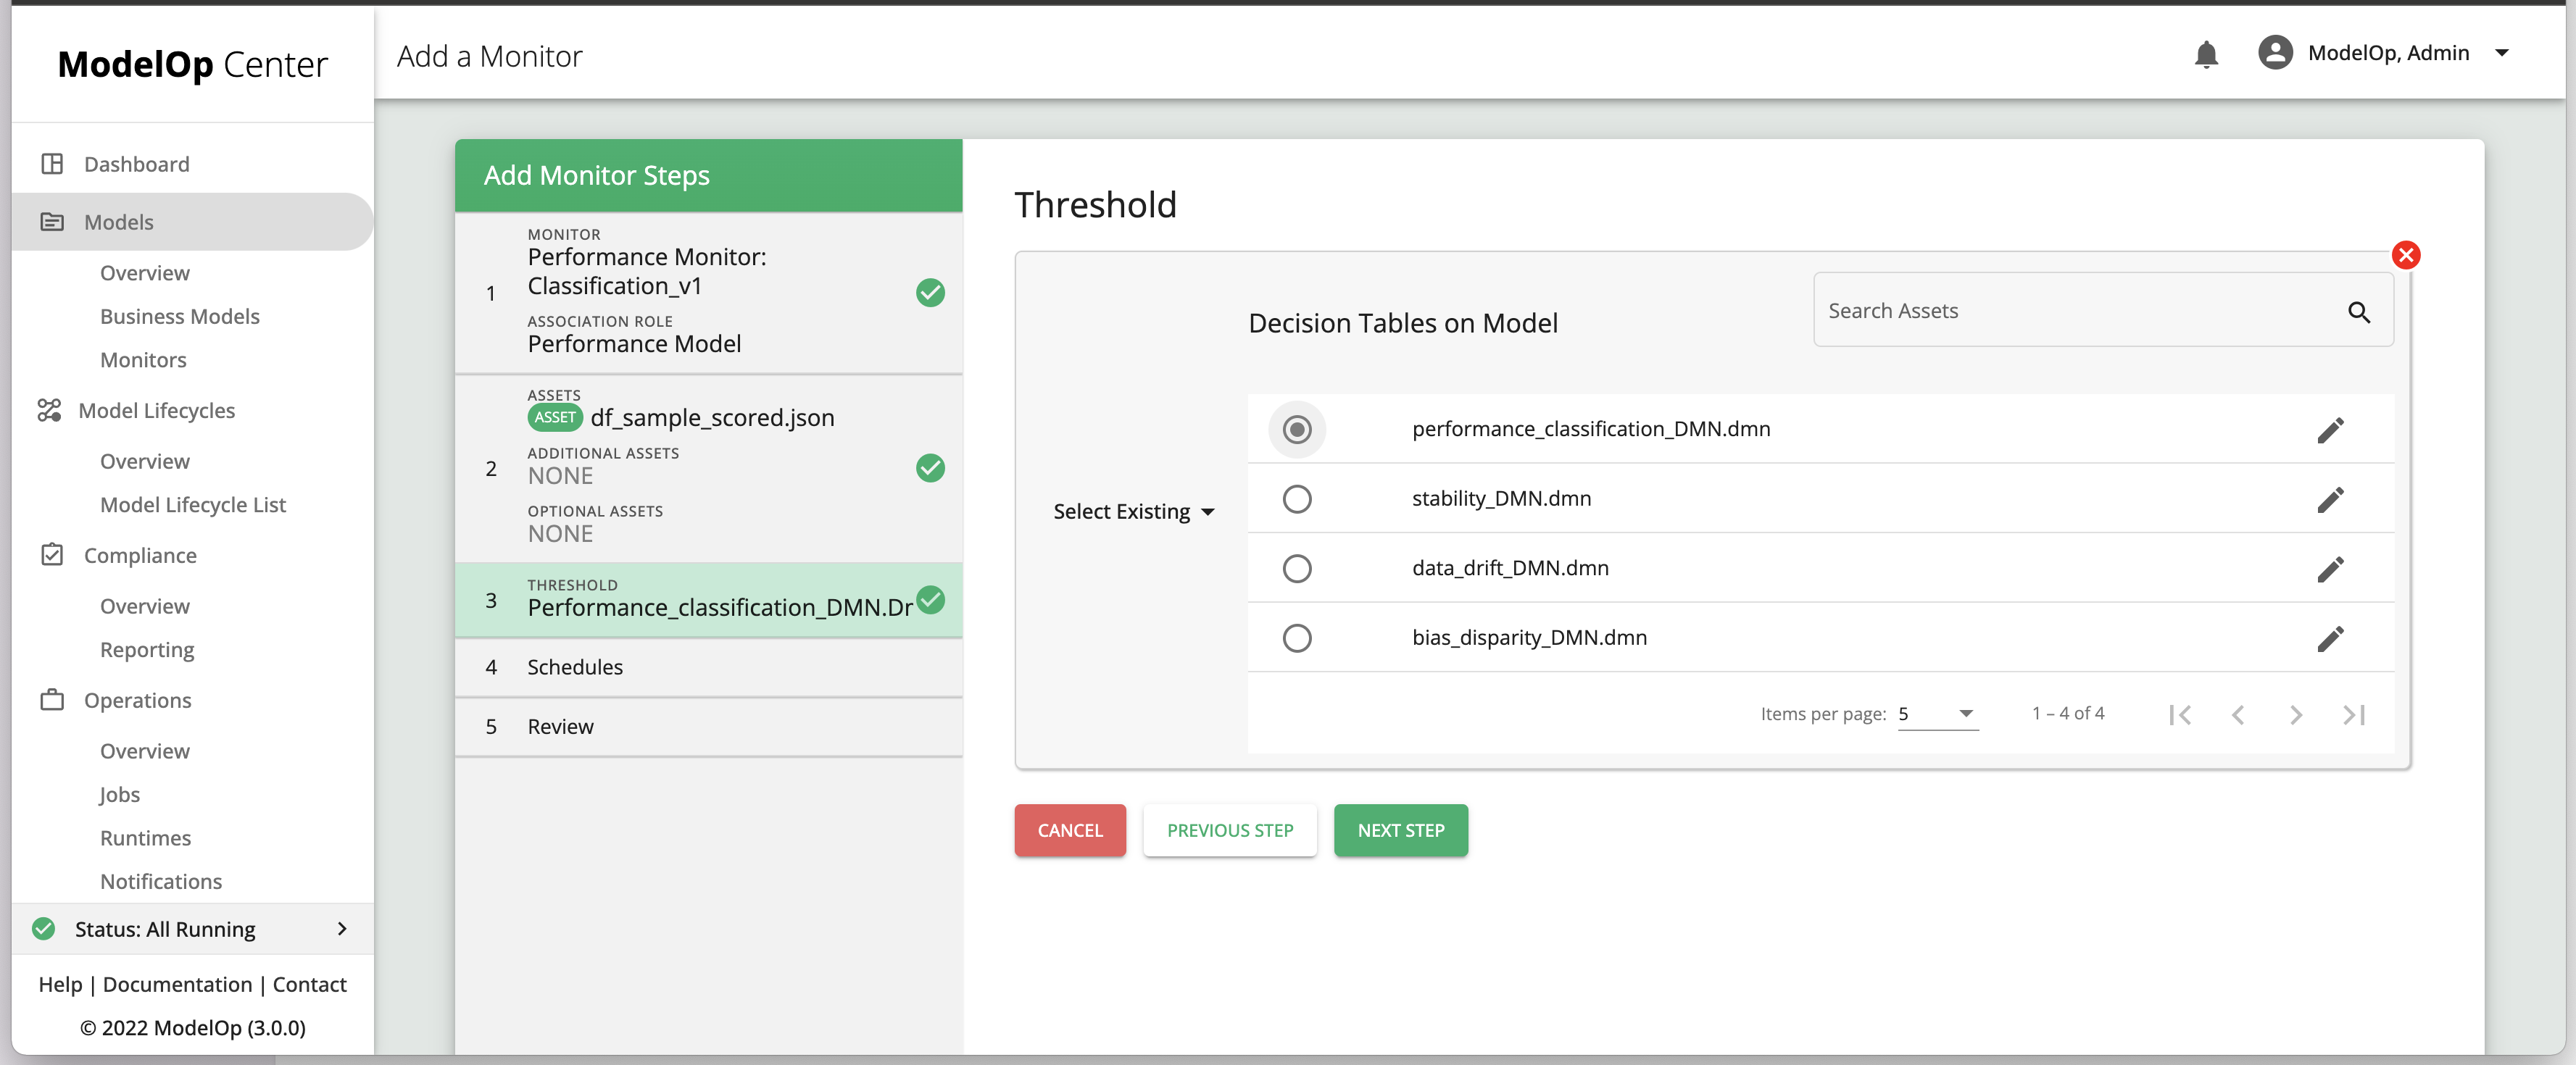
The last step in adding a monitor is adding an optional schedule. To do so, click on
ADD A SCHEDULE. TheSchedule Namefield is free-form. TheSignal Namefield is a dropdown. Choose a signal that corresponds to your ticketing system (Jira, ServiceNow). Lastly, set the frequency of the monitoring job. This can be done either by the wizard or by entering a cron expression. Note: schedules are optional; a monitor may be run on-demand from the business model’s snapshot page, or by a curl command.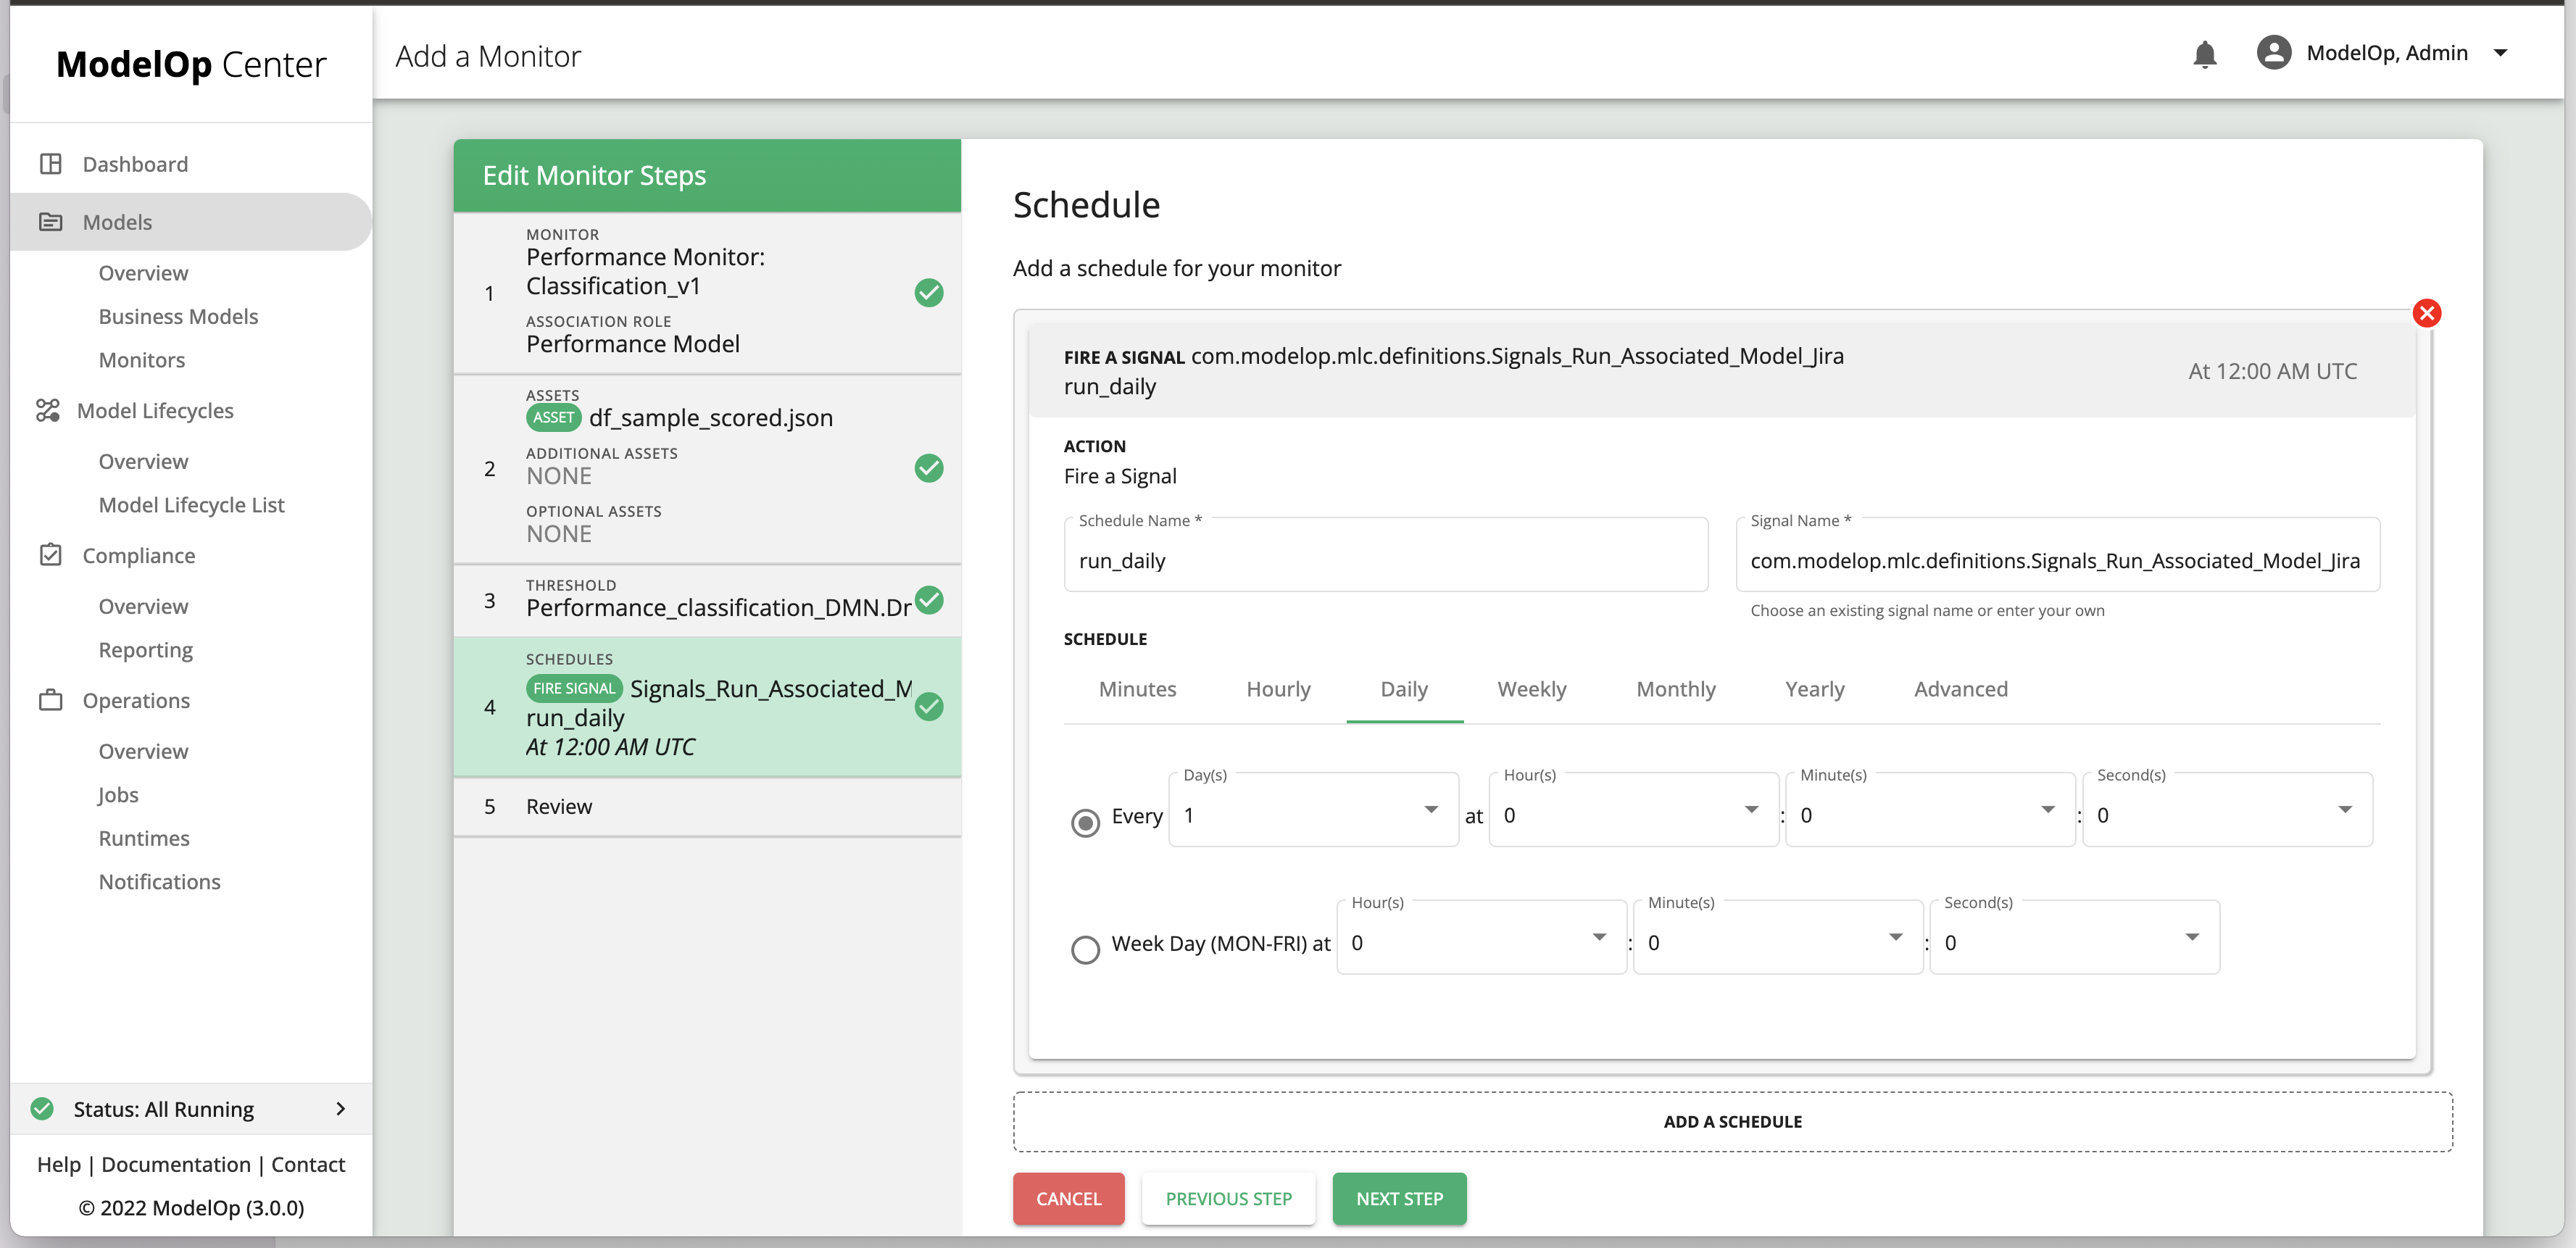
On the
Reviewpage clickSAVE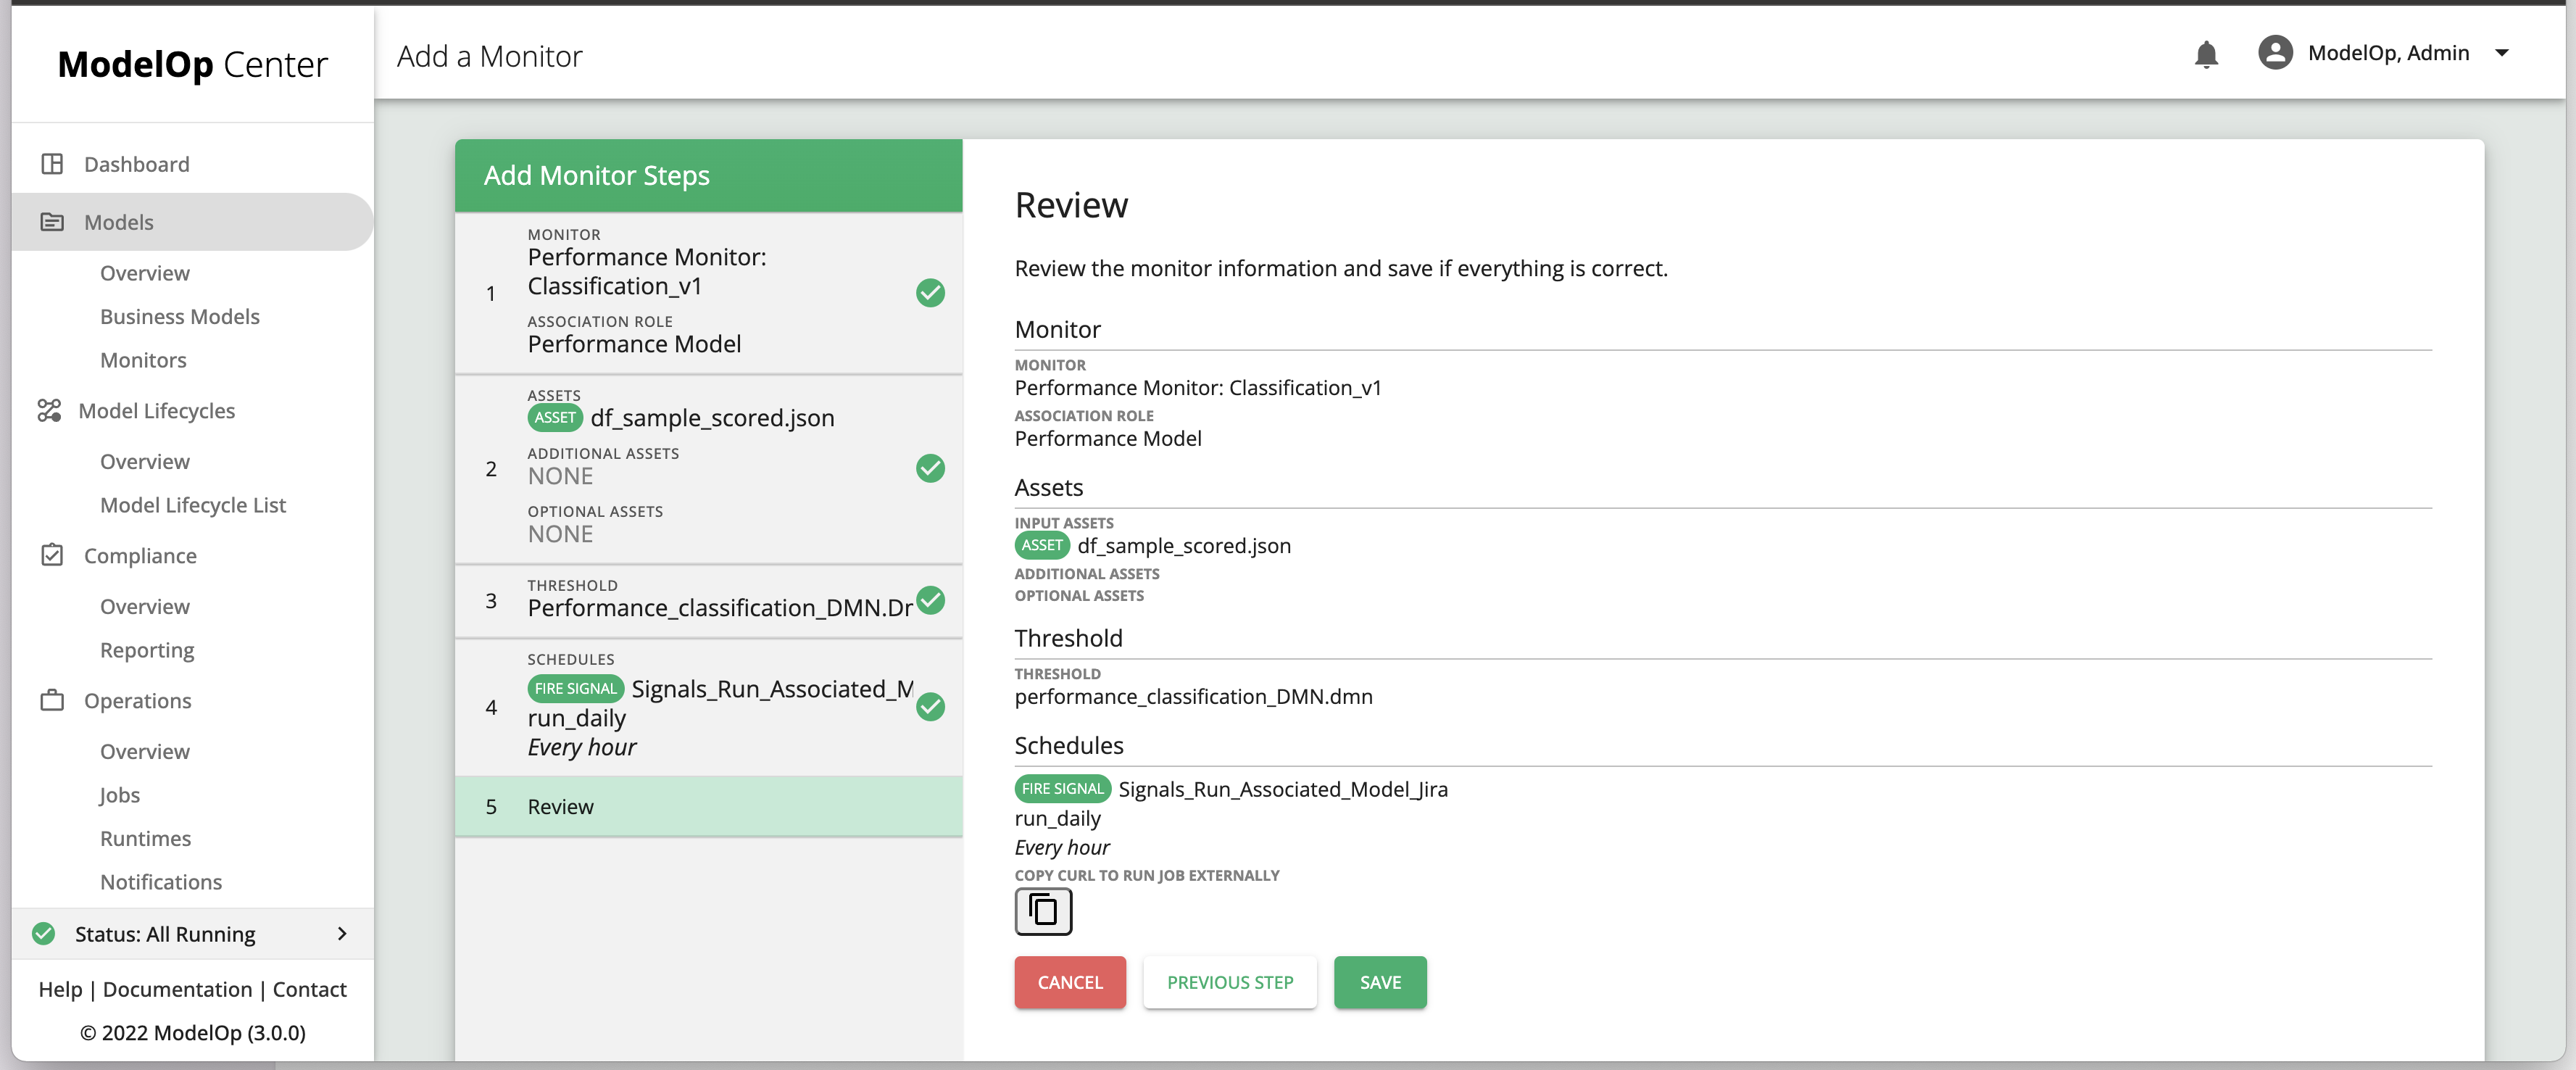
To run a monitor on demand, click on COPY CURL TO RUN JOB EXTERNALLY. The CURL command can then be run from the application of your choosing.
Define
thresholdsThresholds for your
modelModel
As mentioned in the Monitoring Concepts article, ModelOp Center uses decision tables to define the thresholds within which the model should operate for the given monitor.
The first step is to define these thresholds. For this tutorial, we will leverage the example
performance_classification_DMN.dmndecision table. Specifically, this decision table ensures that the F1 Score, AUC, Precision, and Recall metrics of the German Credit Model are within specification.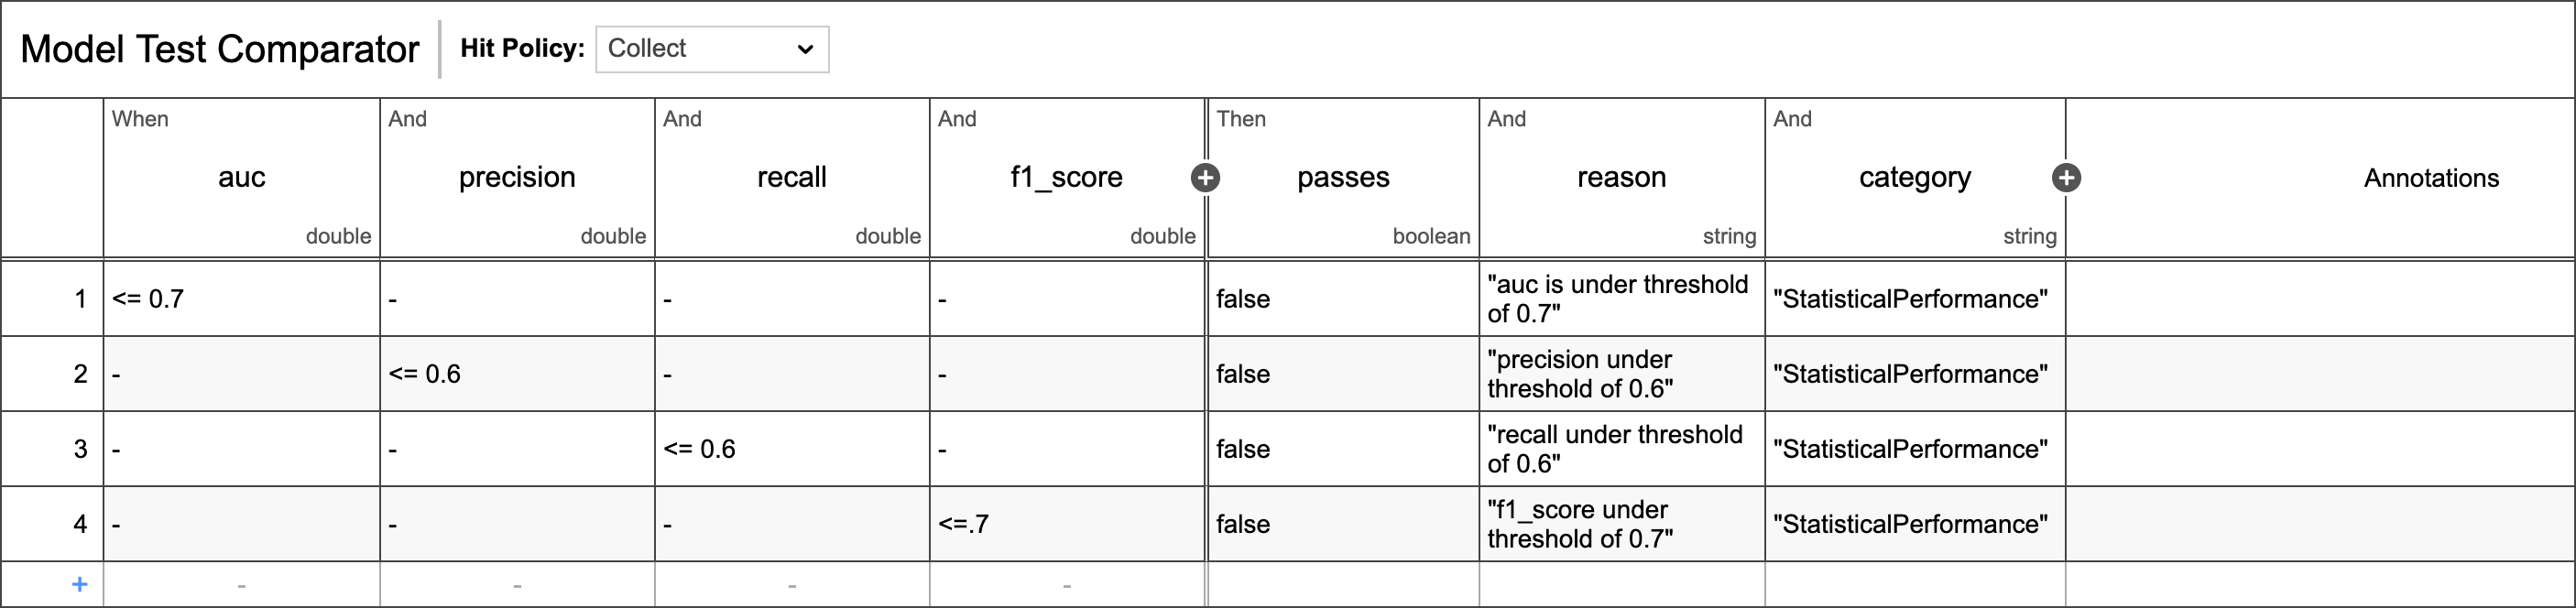
The
auc,f1_score,precision, andrecallvalues can be accessed directly from the Monitoring Test Result by design. More metrics are produced OOTB by the performance monitor. We will discuss this in more detail later.In our example, the
.dmnfile is already an asset of the business model and versioned/managed along with the source code in the same Github repo. This is considered best practice, as the decision tables are closely tied to the specific business model under consideration. However, it is not a requirement that the.dmnfiles are available as model assets ahead of time.
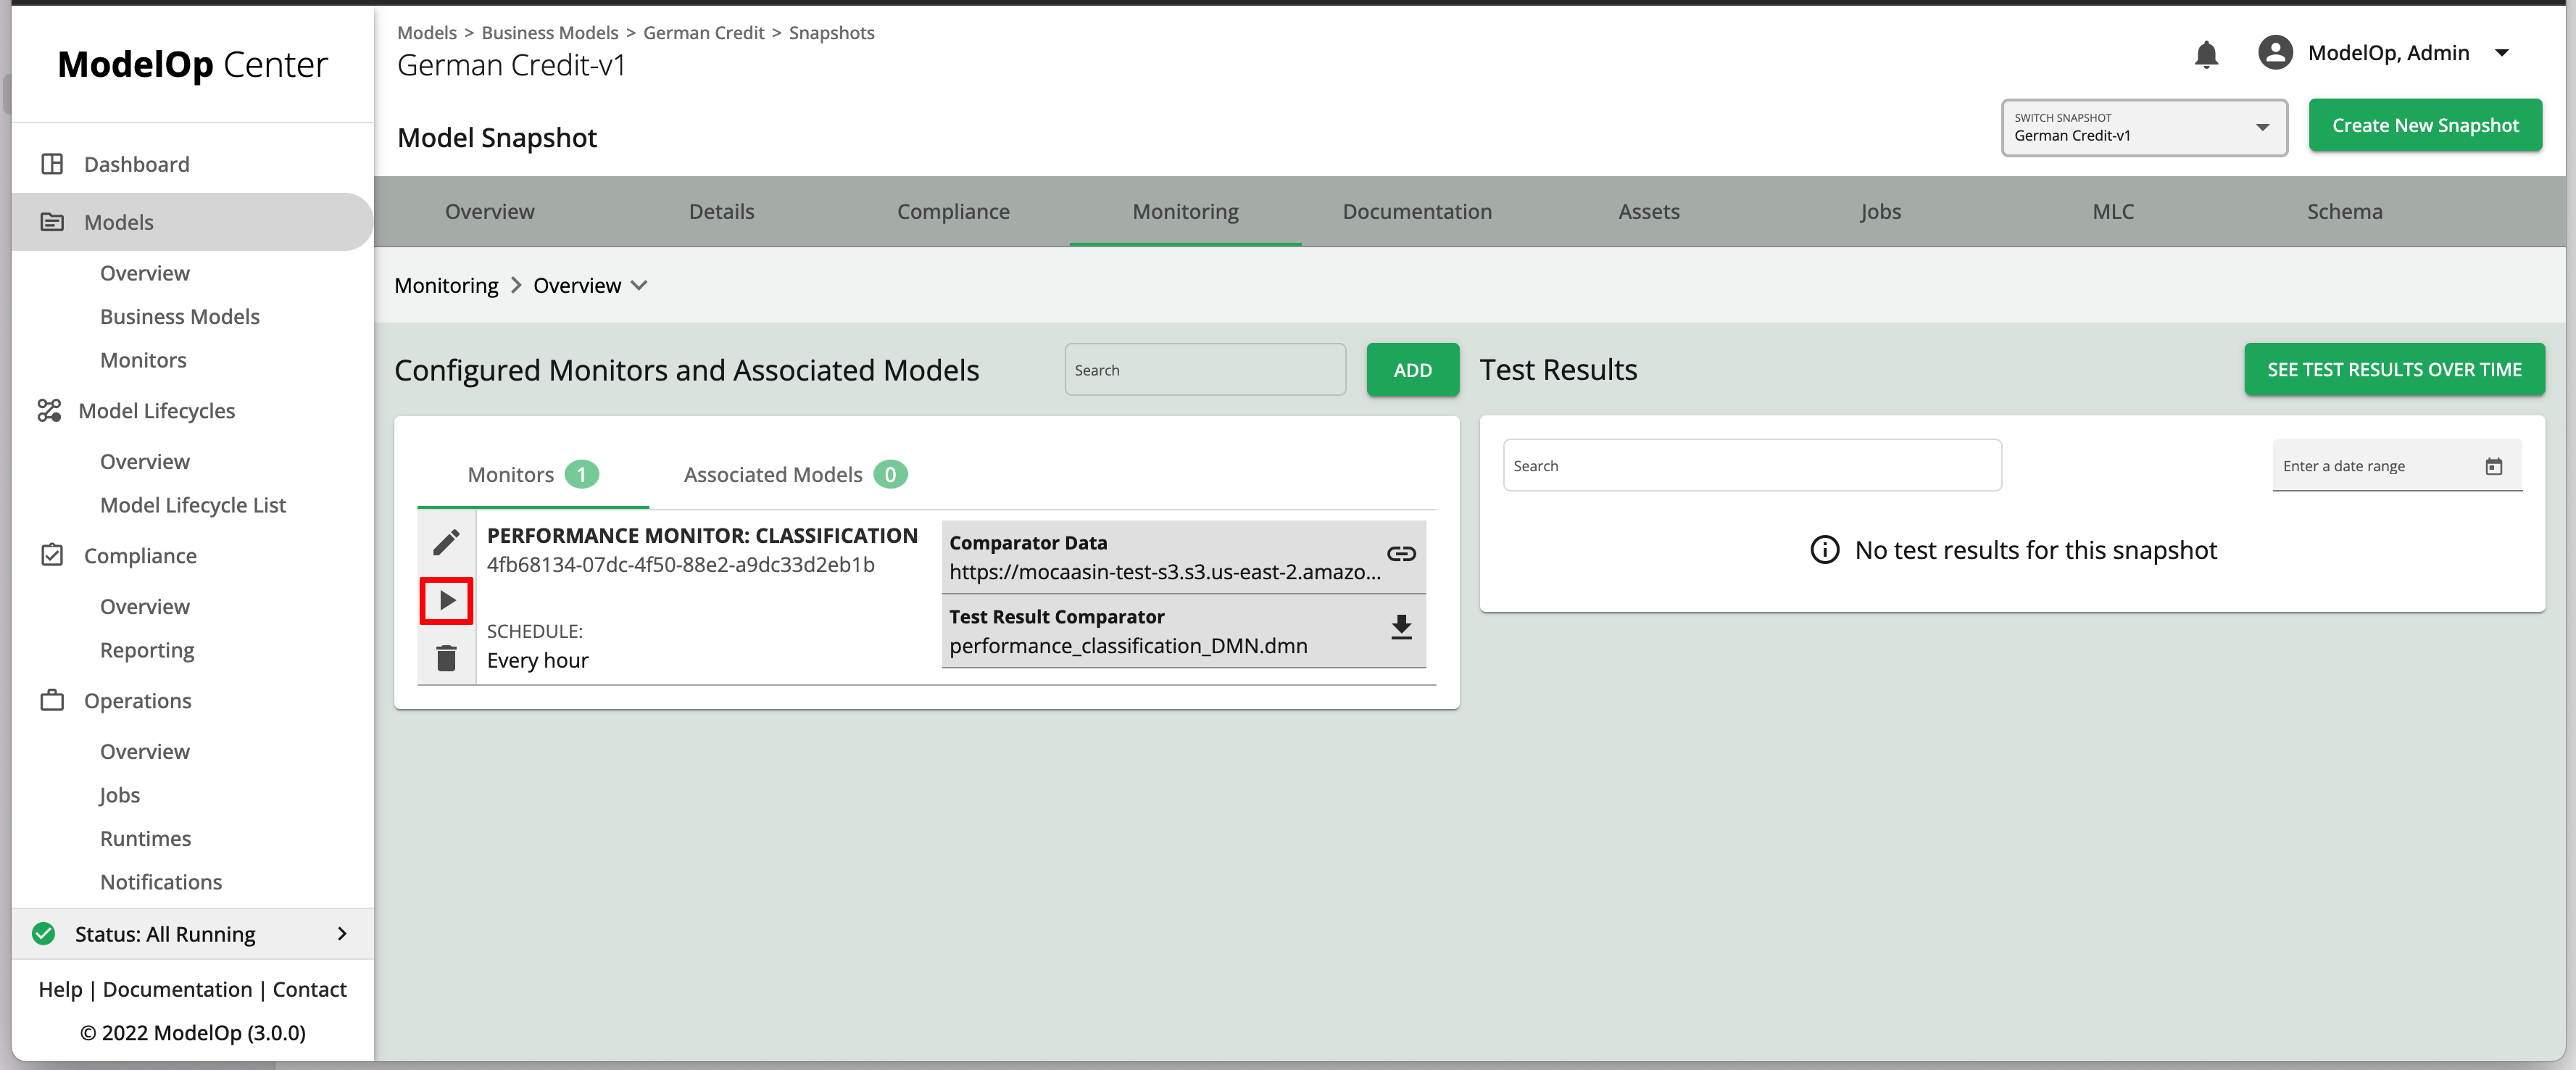
Run a Monitor On-demand (UI)
To run a monitor on-demand from the UI, navigate to the business model’s snapshot page and click the play button next to the monitor of interest. A monitoring job will be initiated, and you will be redirected to the corresponding job page once the job is created.
Scheduling a Monitor
-DIY (CURL)
Monitors can also be scheduled to run using your preferred enterprise scheduling capability (Control-M, Airflow, Autosys, etc.)
While the details will depend on the specific scheduling software, at the highest level, the user simply needs to create a REST call to the ModelOp Center API. Here are the steps:
Obtain the Business Model snapshot’s UUID. This can be found, for instance, in the URL of the snapshot page, as shown in this example:

Similarly, obtain the Monitoring Model snapshot’s UUID.
Within the scheduler, configure the REST call to ModelOp Center’s automation engine to trigger the monitor for your model:
Obtain a valid auth token
Make a call (POST) to the ModelOp Center API to initiate the monitor. The endpoint is
Code Block <MOC_INSTANCE_URL>/mlc-service/rest/signalThe body should contain references to the Model Life Cycle (MLC) being triggered, as well as the business model and monitor snapshots, as shown below:
Code Block { "name": "com.modelop.mlc.definitions.Signals_Run_Associated_Model_Jira", "variables": { "DEPLOYABLE_MODEL_ID" : { "value": <UUID_of_business_model_snapshot_as_a_string> }, "ASSOCIATED_MODEL_ID": { "value": <UUID_of_monitoring_model_snapshot_as_a_string> } } }For more details on triggering monitors, visit the article Triggering Metrics Tests.
This process is made easier by copying the CURL command provided at the last step of the monitoring wizard
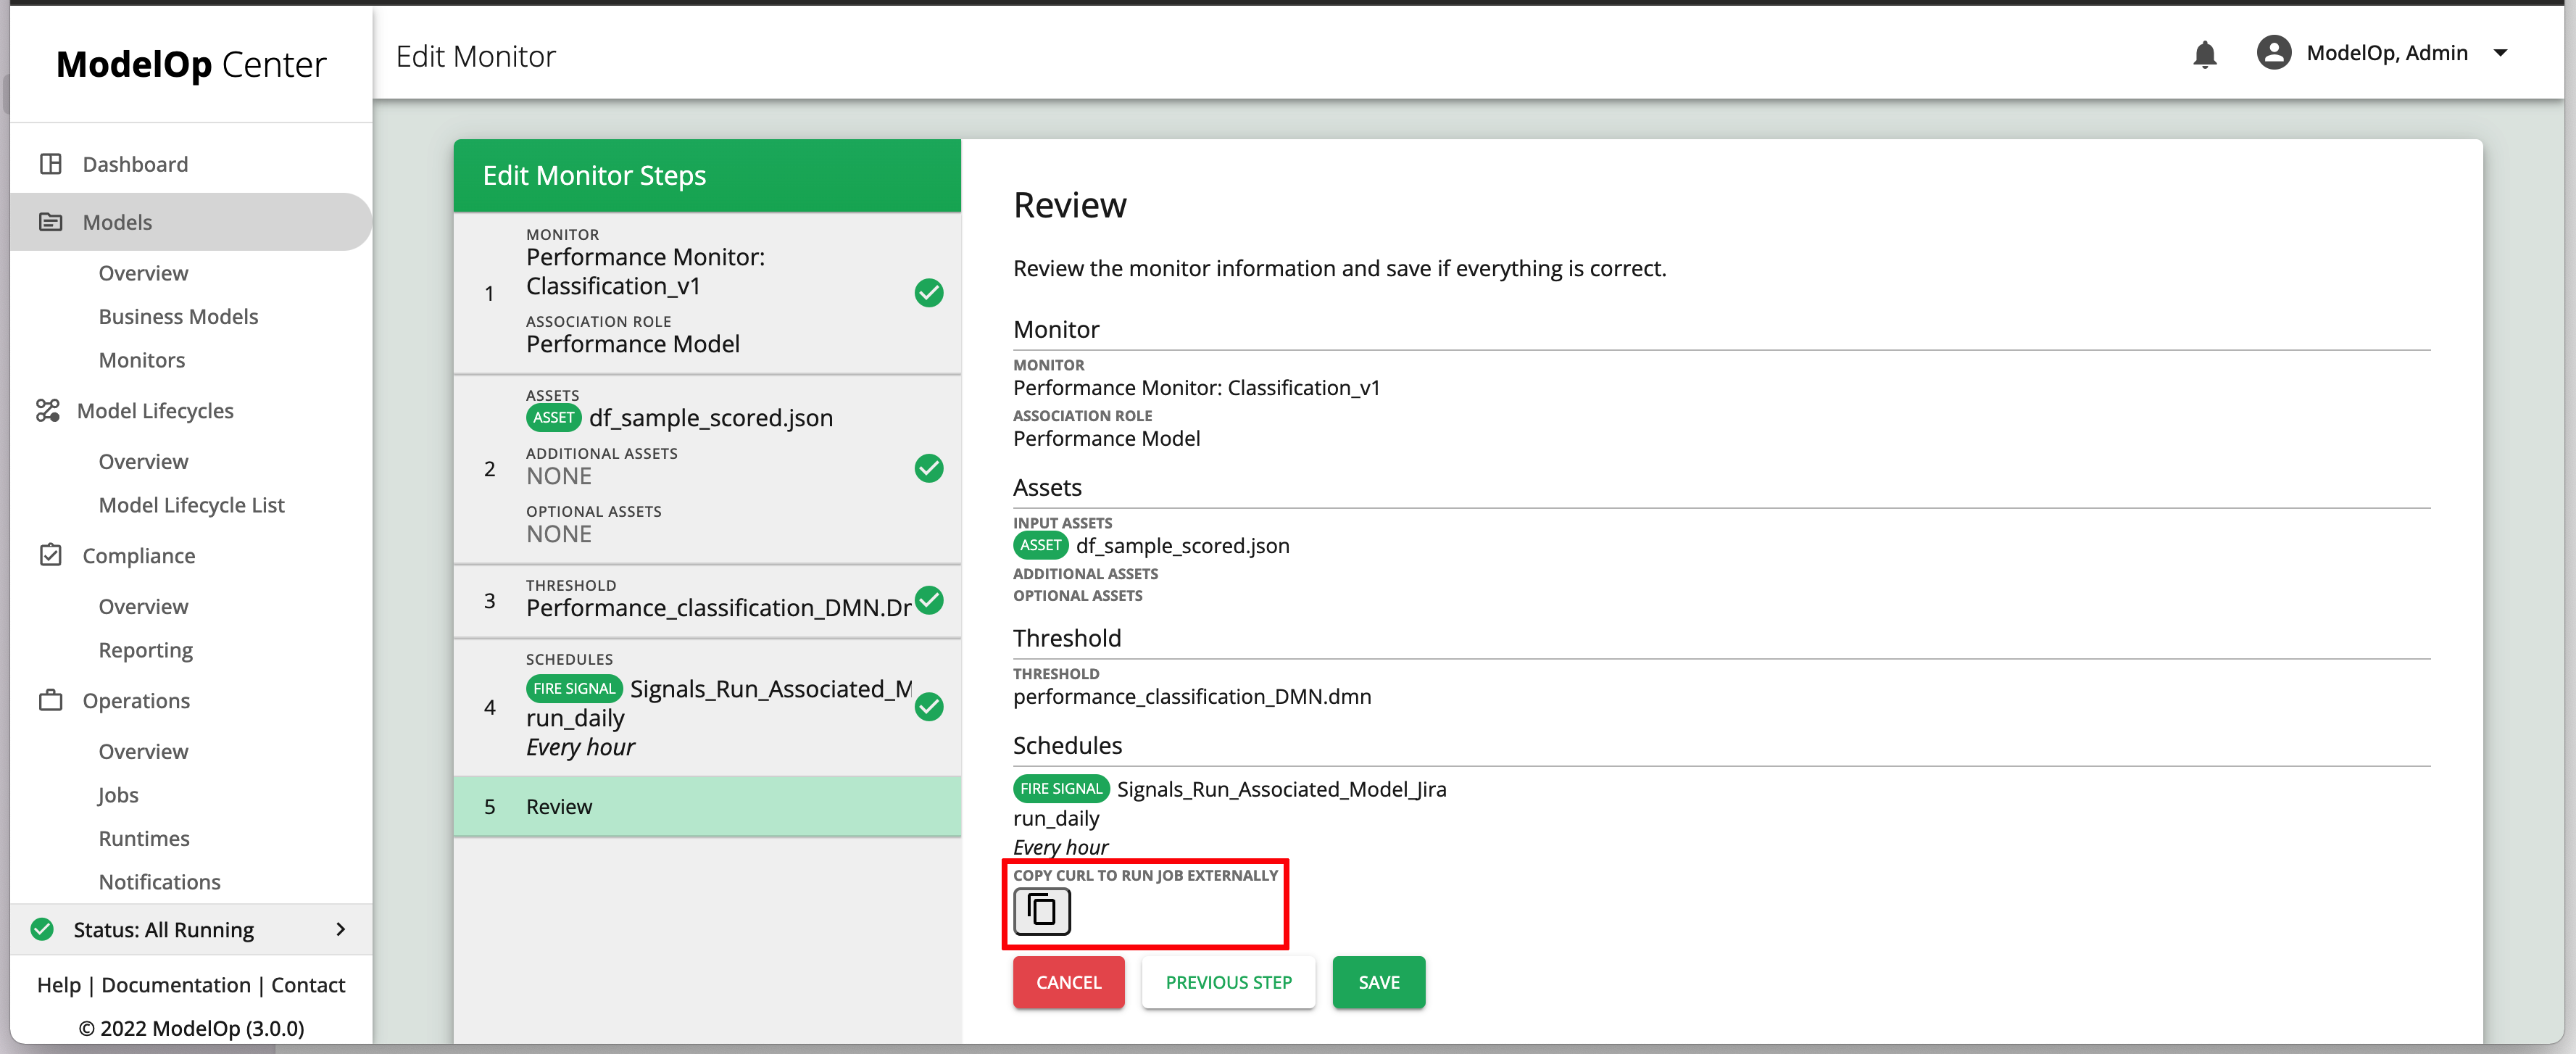
The copied command will look something like this:
curl 'http://mocaasin.modelop.center/mlc-service/rest/signalResponsive' -H 'Accept: application/json, text/plain, /' -H 'Content-Type: application/json' -X POST -H 'Authorization: Bearer <token>' --data-raw '{"name":"com.modelop.mlc.definitions.Signals_Run_Associated_Model_Jira","variables":{"DEPLOYABLE_MODEL_ID":{"value":"aa65e4b8-d303-4609-9bb1-0cce1d677869"},"ASSOCIATED_MODEL_ID":{"value":"4fb68134-07dc-4f50-88e2-a9dc33d2eb1b"}}}'
Monitoring Execution
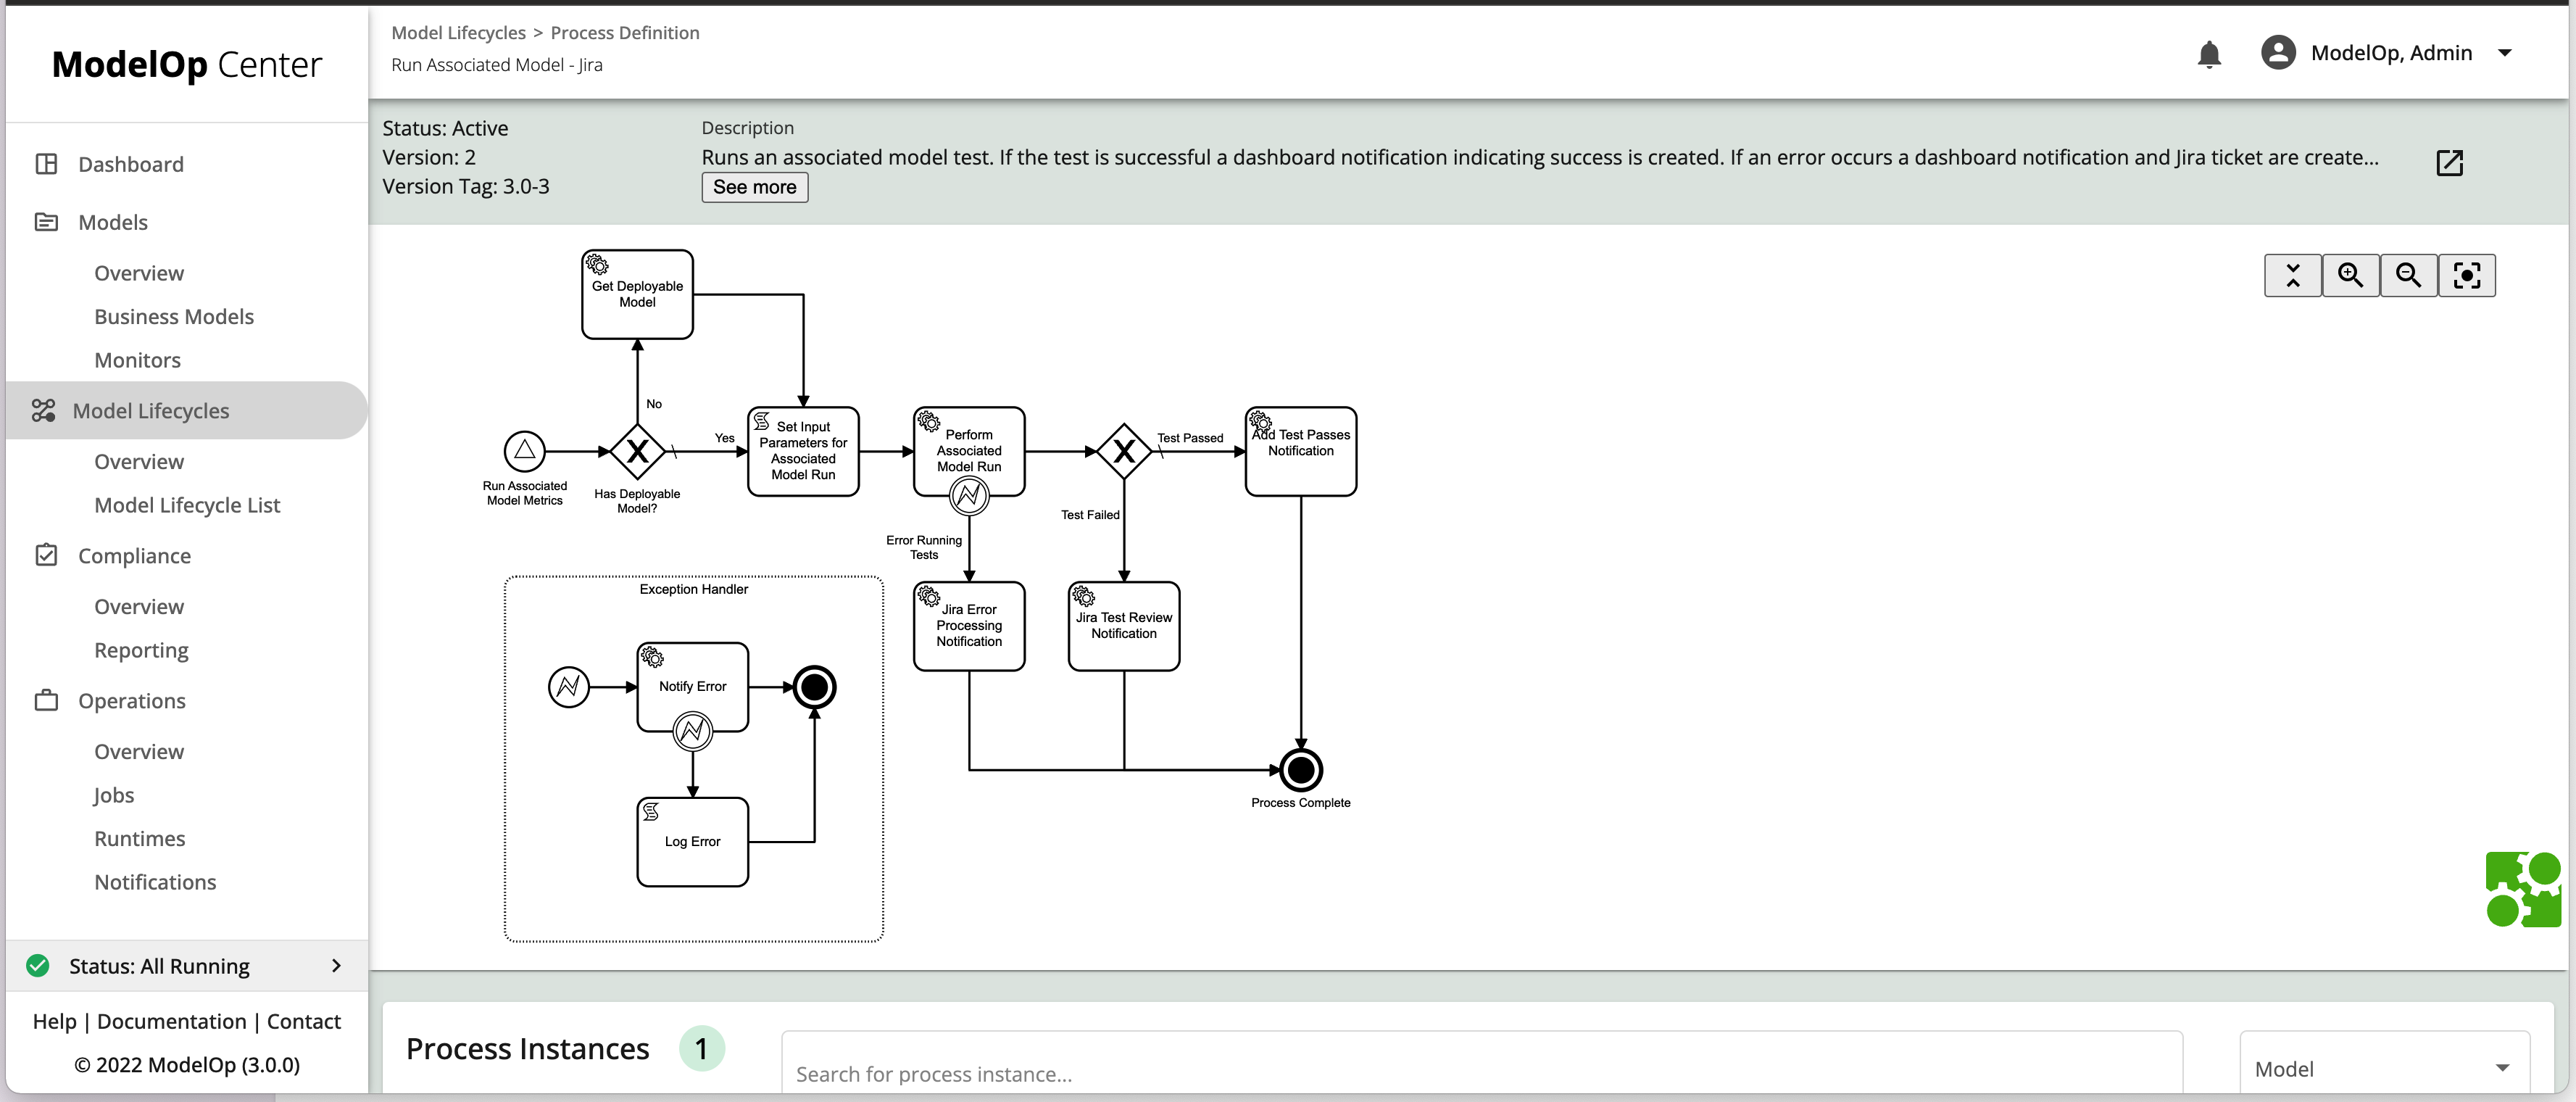
Once the scheduler triggers the signal, the corresponding MLC (listening to that signal) will be initiated. The sequence of events include:
Preparing the monitoring job with all artifacts necessary to run the job
Creating the monitoring job
Parsing the results into viewable test results
Comparing the results against the thresholds in the decision table
Taking action, which could include creating a notification and/or opening up an incident in JIRA/ServiceNow/etc.

These steps can be summarized in the following Model Life Cycle (MLC)
Monitoring Results and Notifications
To run a monitor manually, see the Running a Monitor Manually article.
To see the results of a monitor, see the Viewing the Results of a Monitoring Job article.
Sample Standard Output of Performance Monitors
The output of the performance monitoring job can be viewed by clicking on the monitor from “Model Test Results” as shown in the previous section. In this section, you can view the results in a graphical format or in the raw format.
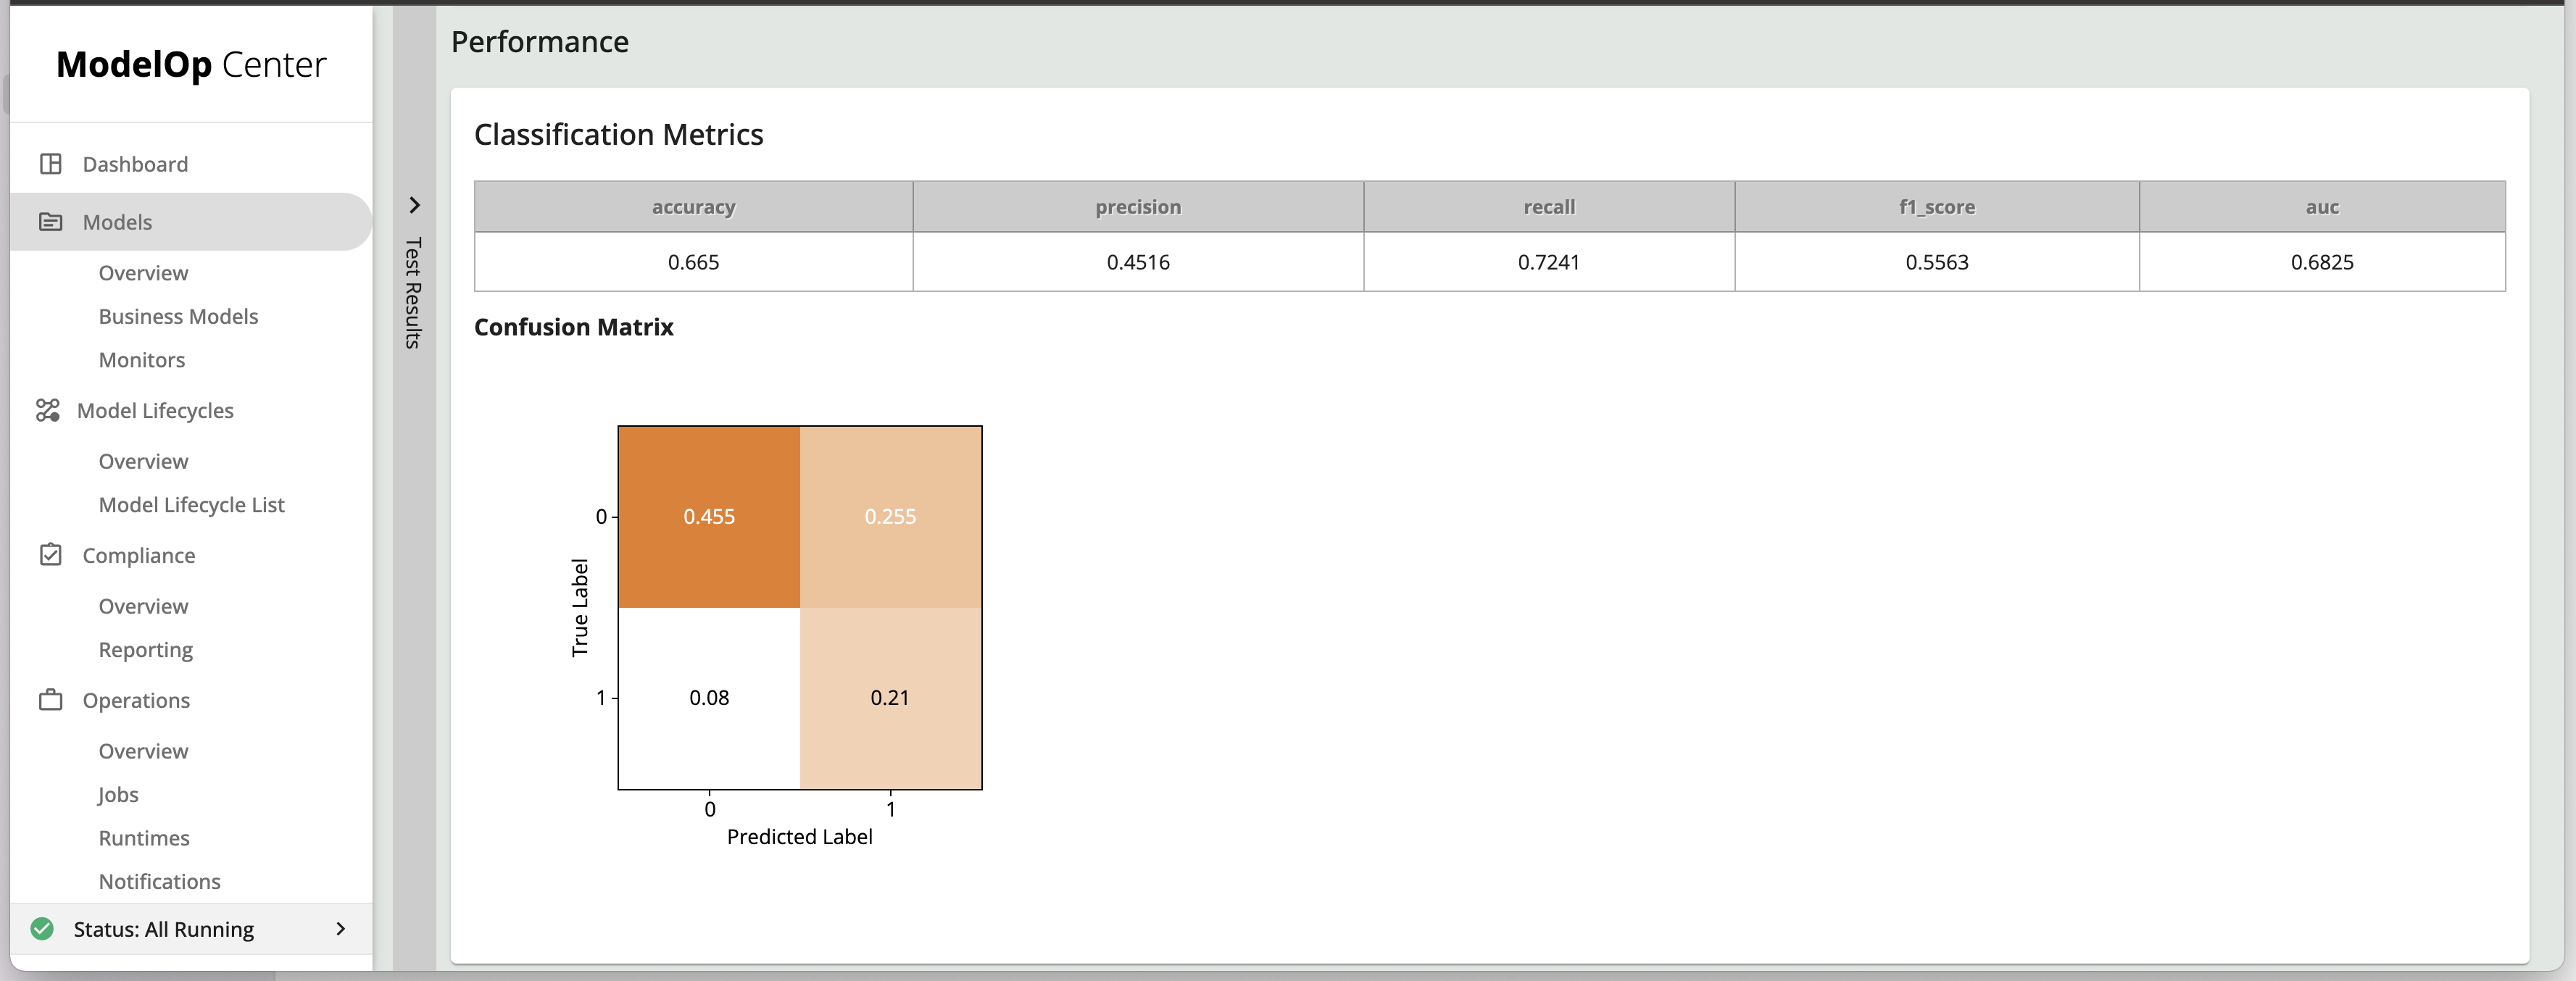
Performance Monitor: Classification Metrics


Performance Monitor: Regression Metrics


Sample Standard Output of Performance Monitors
Monitoring Test Results are listed under the Test Results table:
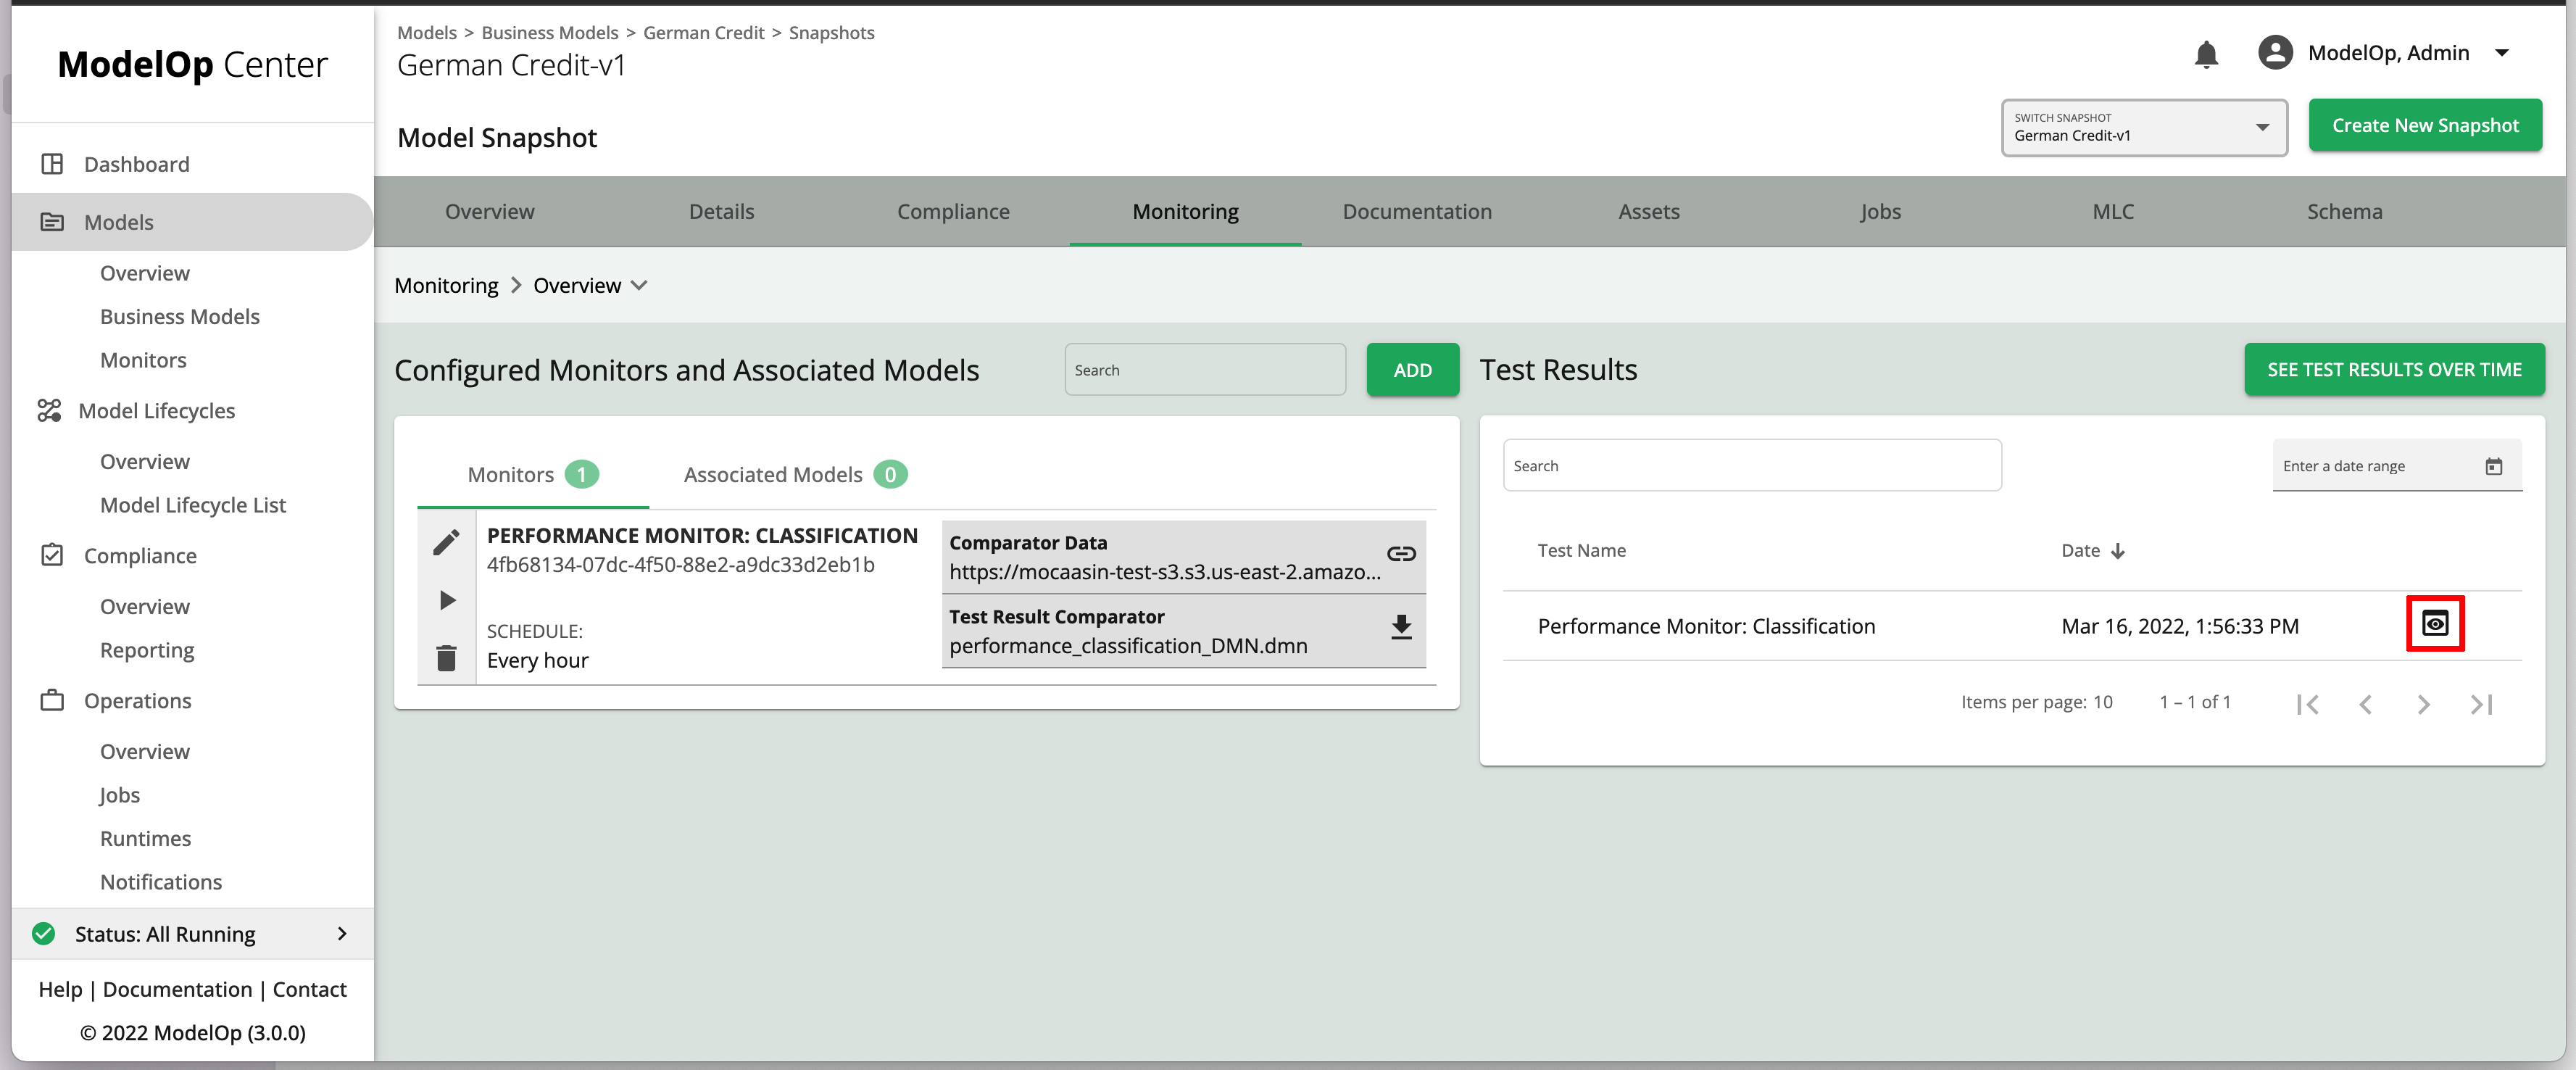
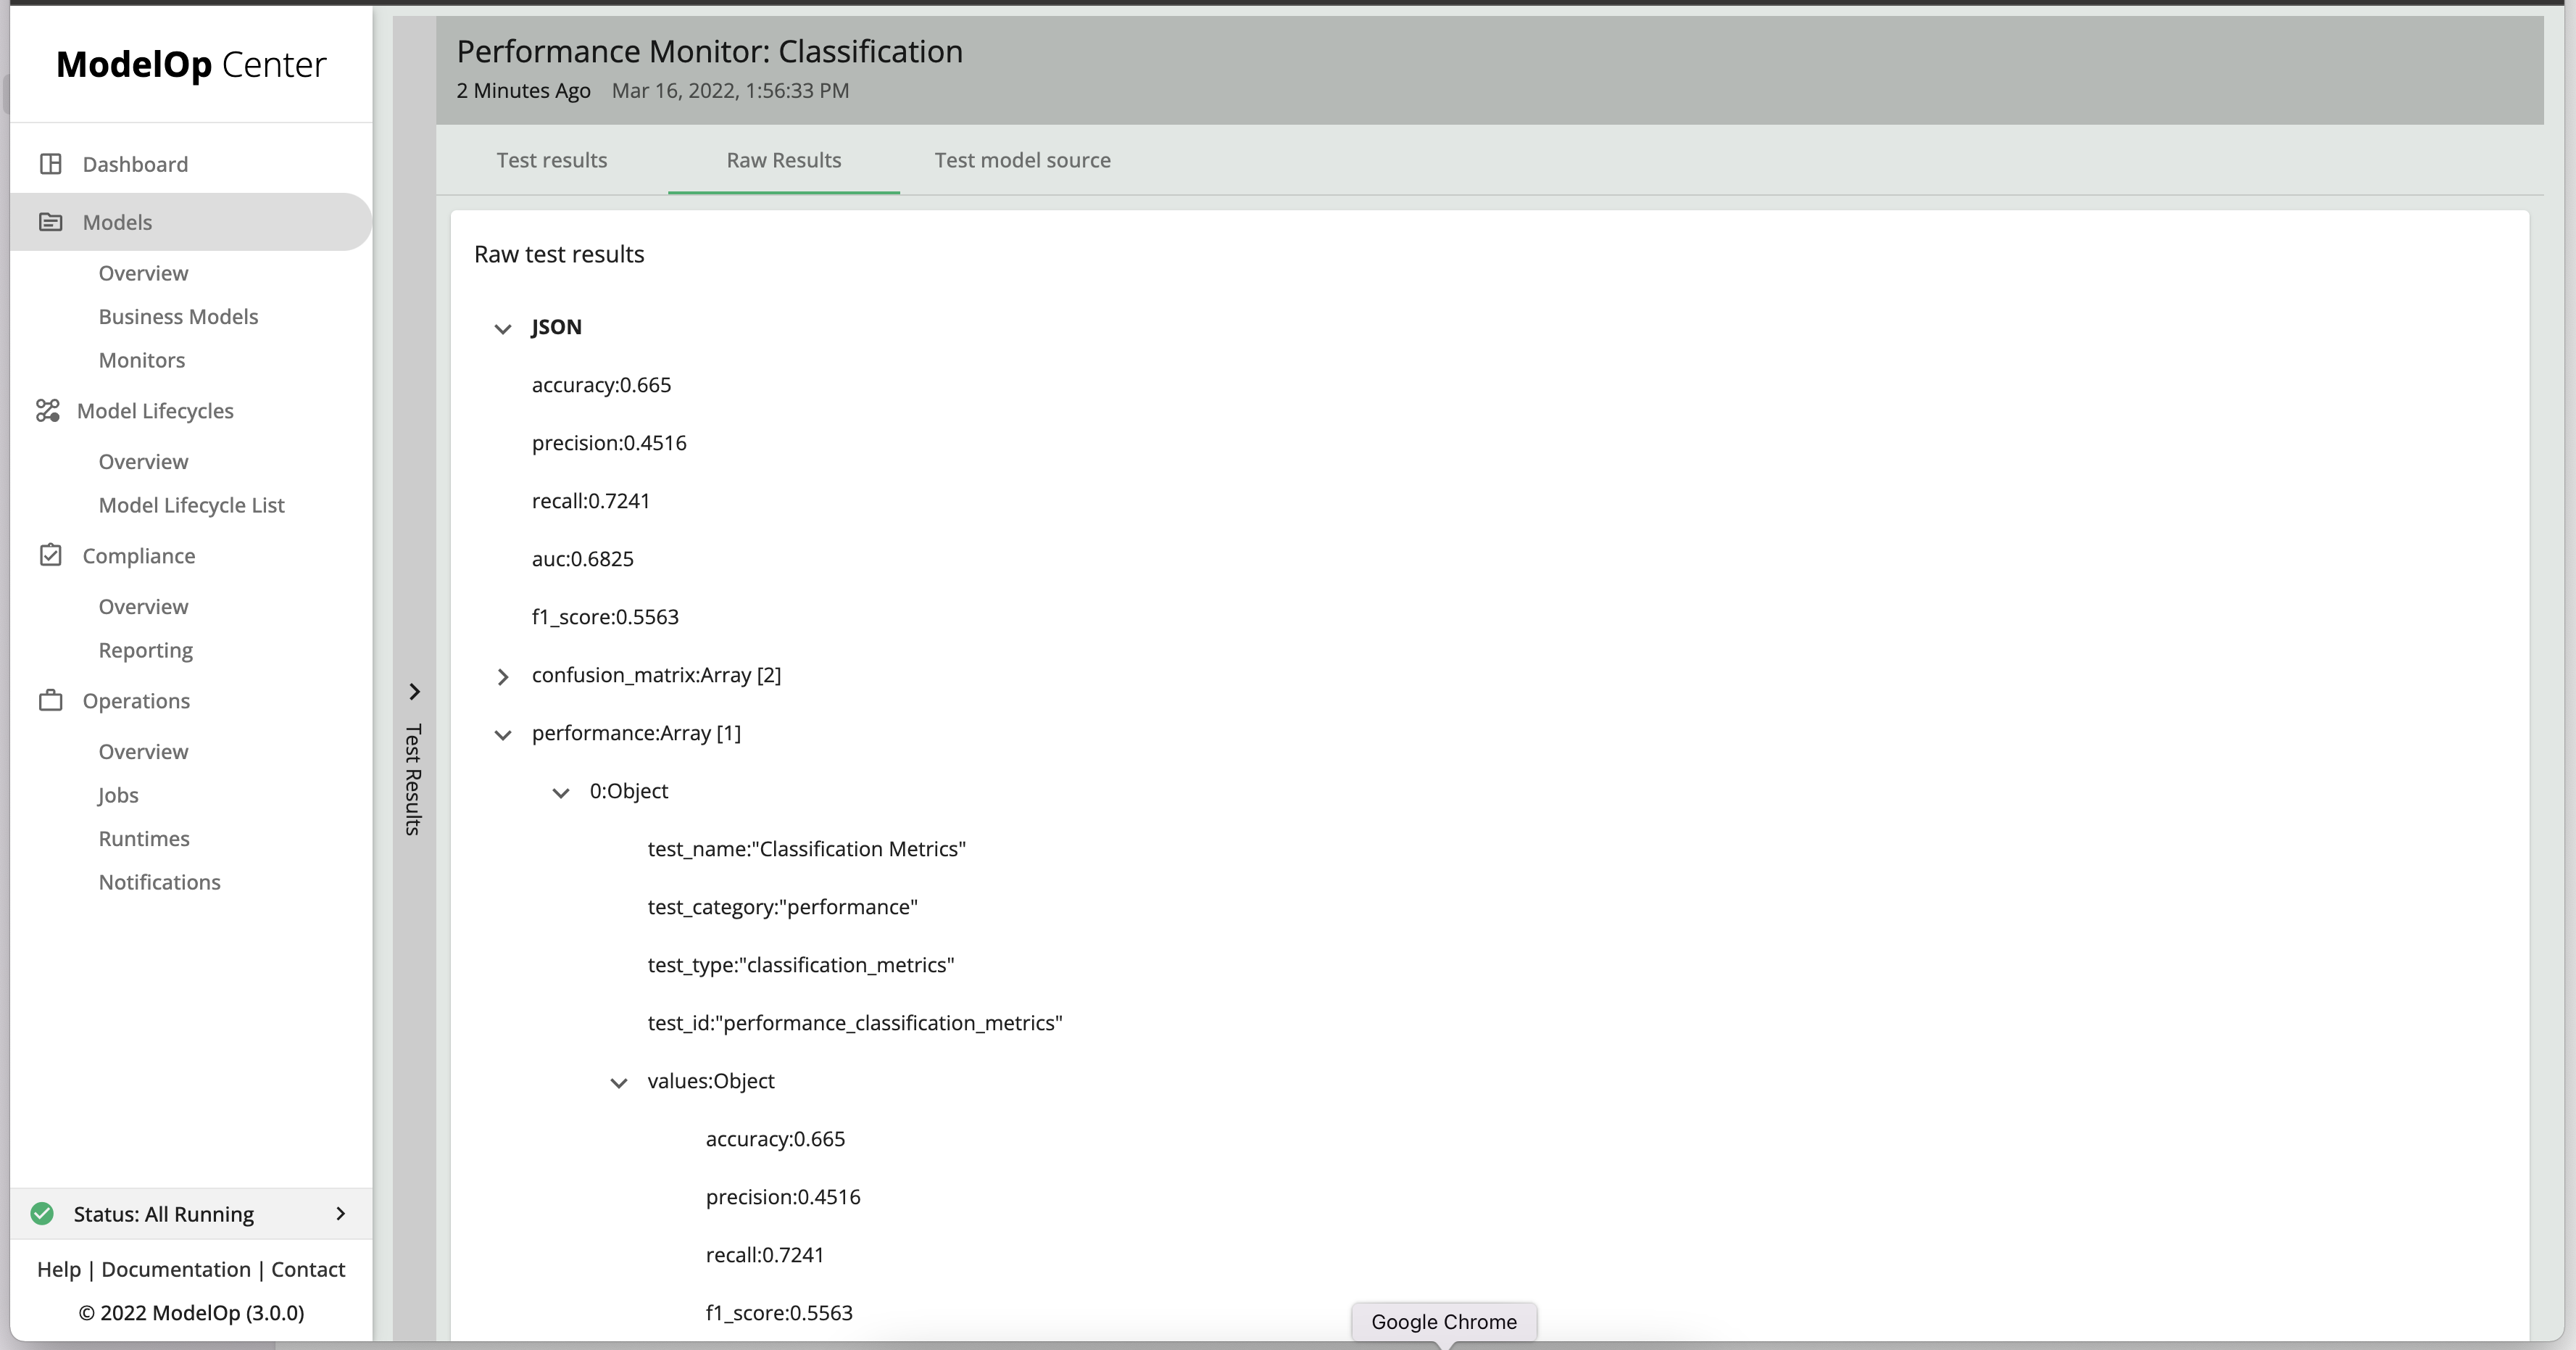
Upon clicking on the “View” icon, you’ll have two options for looking at test results: graphical (under “Test Results”), and raw (under “Raw Results”).
Visual elements
Summary Metrics: these are a subset of all metrics computed by the monitor, returned as
key:valuepairs for ease-of-reference: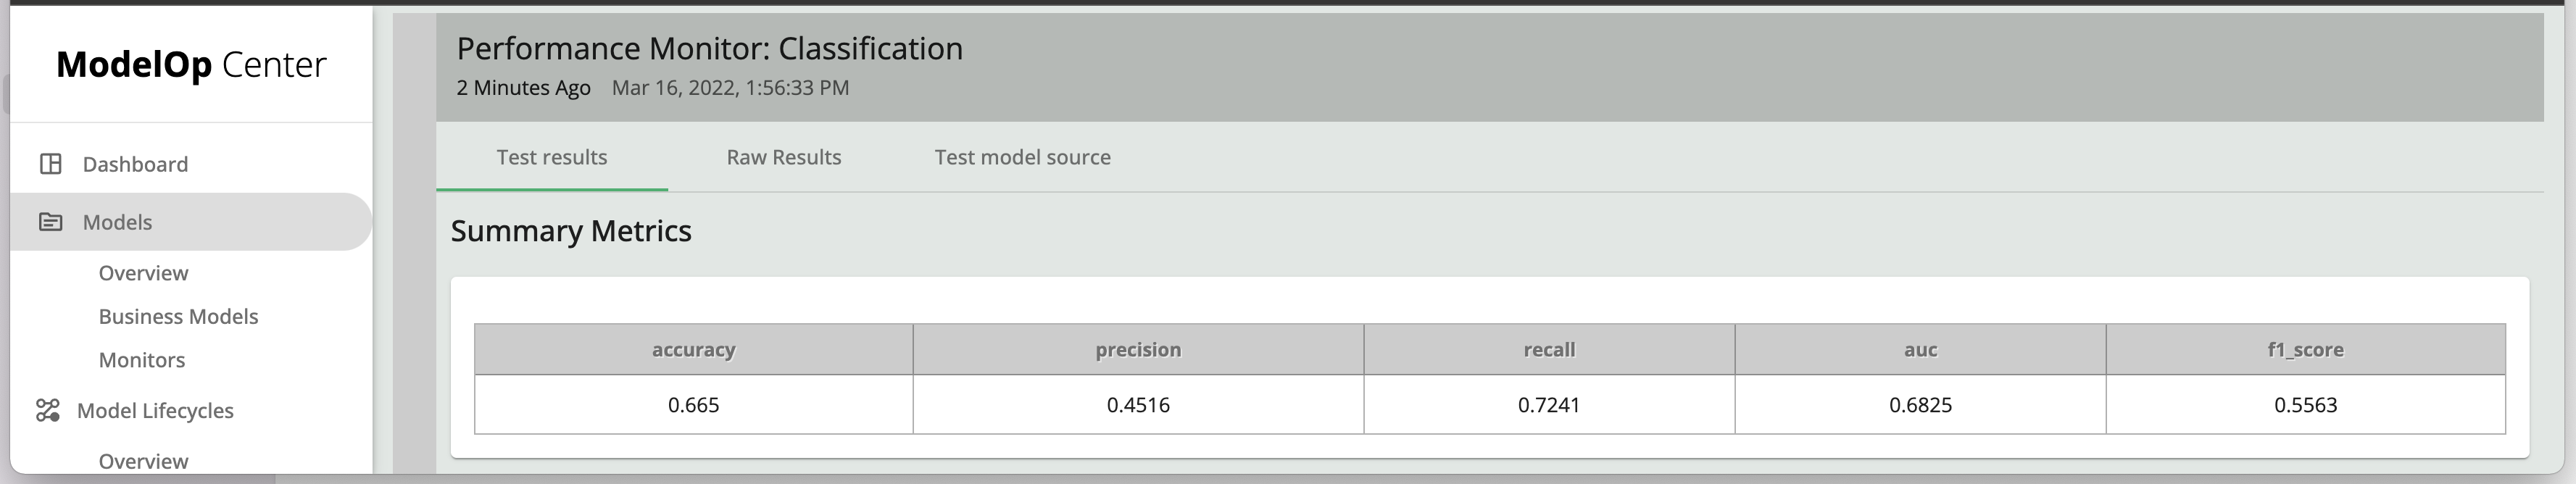
Classification Metrics
Regression Metrics (produced by
Performance Monitor: Regression Metricsfor regression models)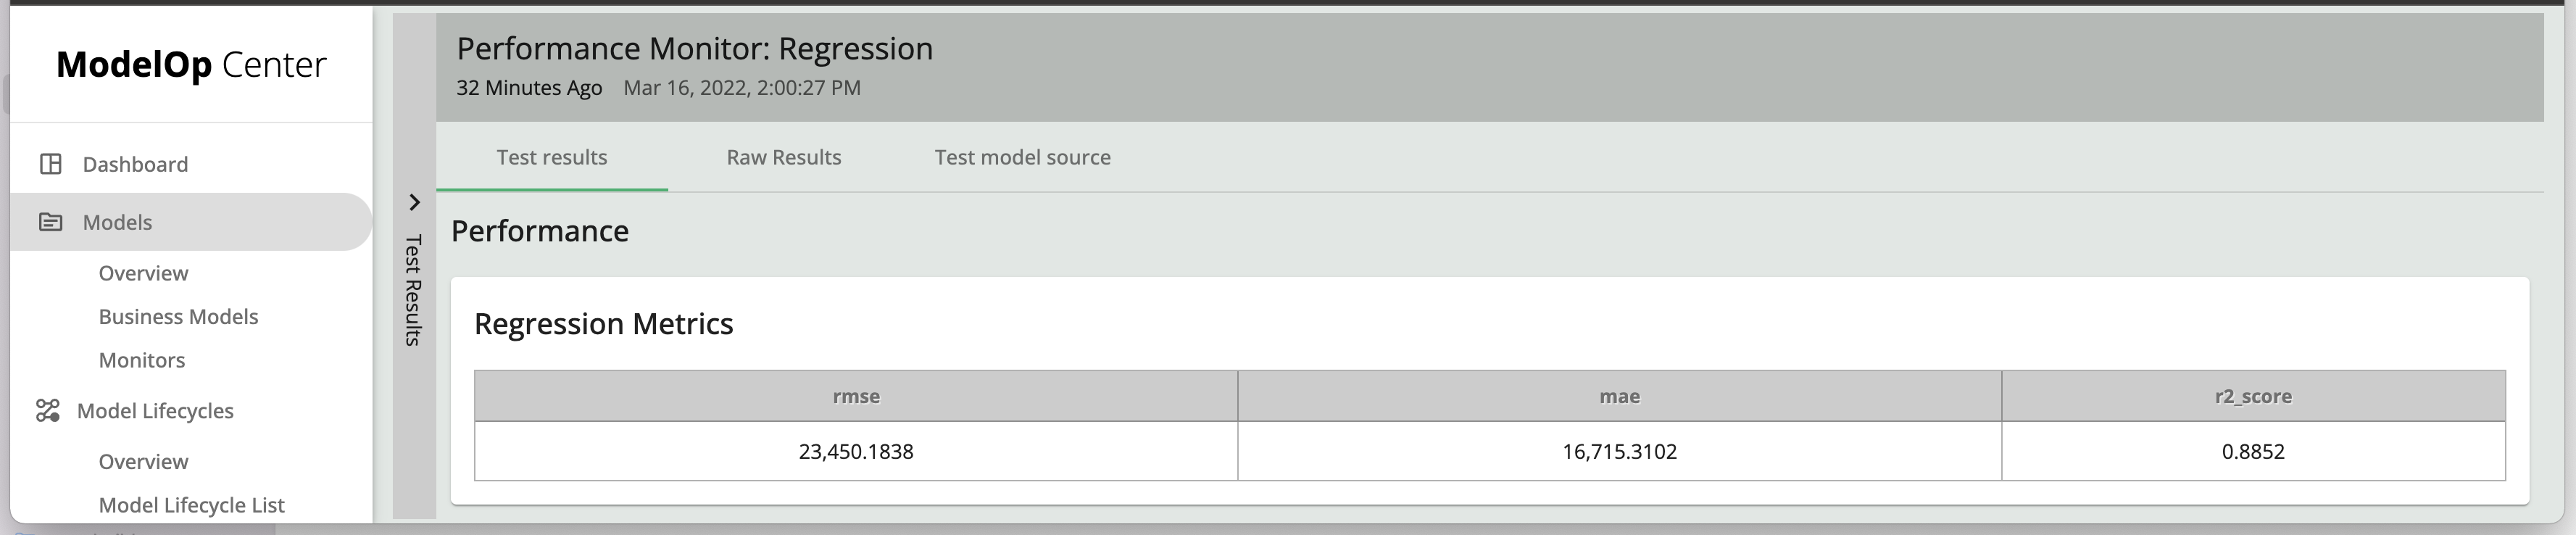
Raw Results
The “Raw Results” tab shows a clickable (expandable and collapsable) JSON representation of the test results
To get a JSON file of the test results,
Navigate to the “Jobs” tab of the snapshot and click on “Details” next to the monitoring job of interest
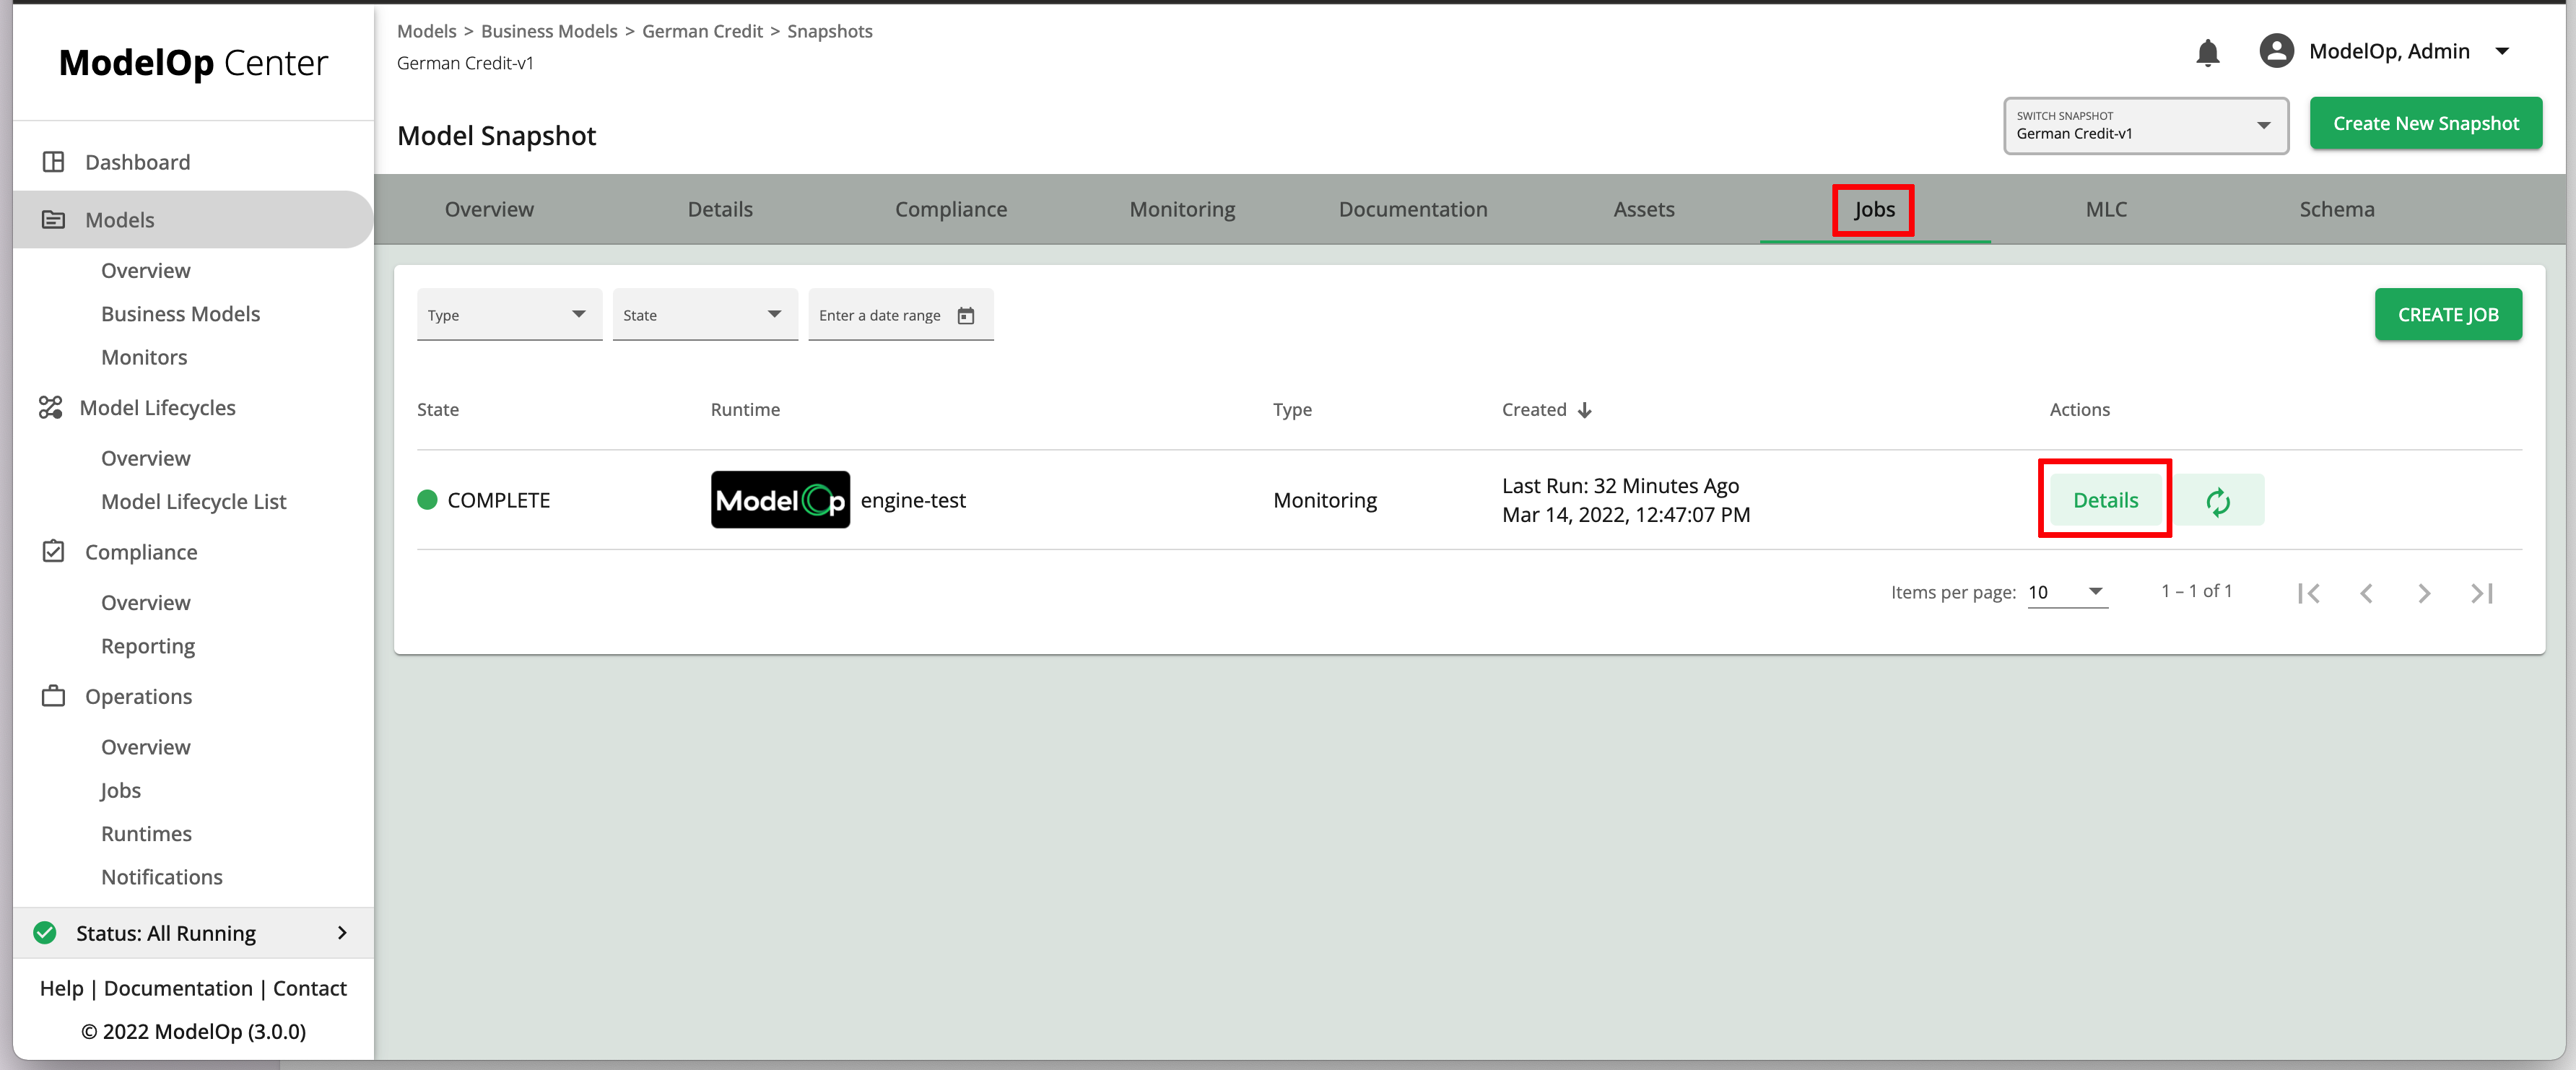
Click on “Download File” under “Outputs”
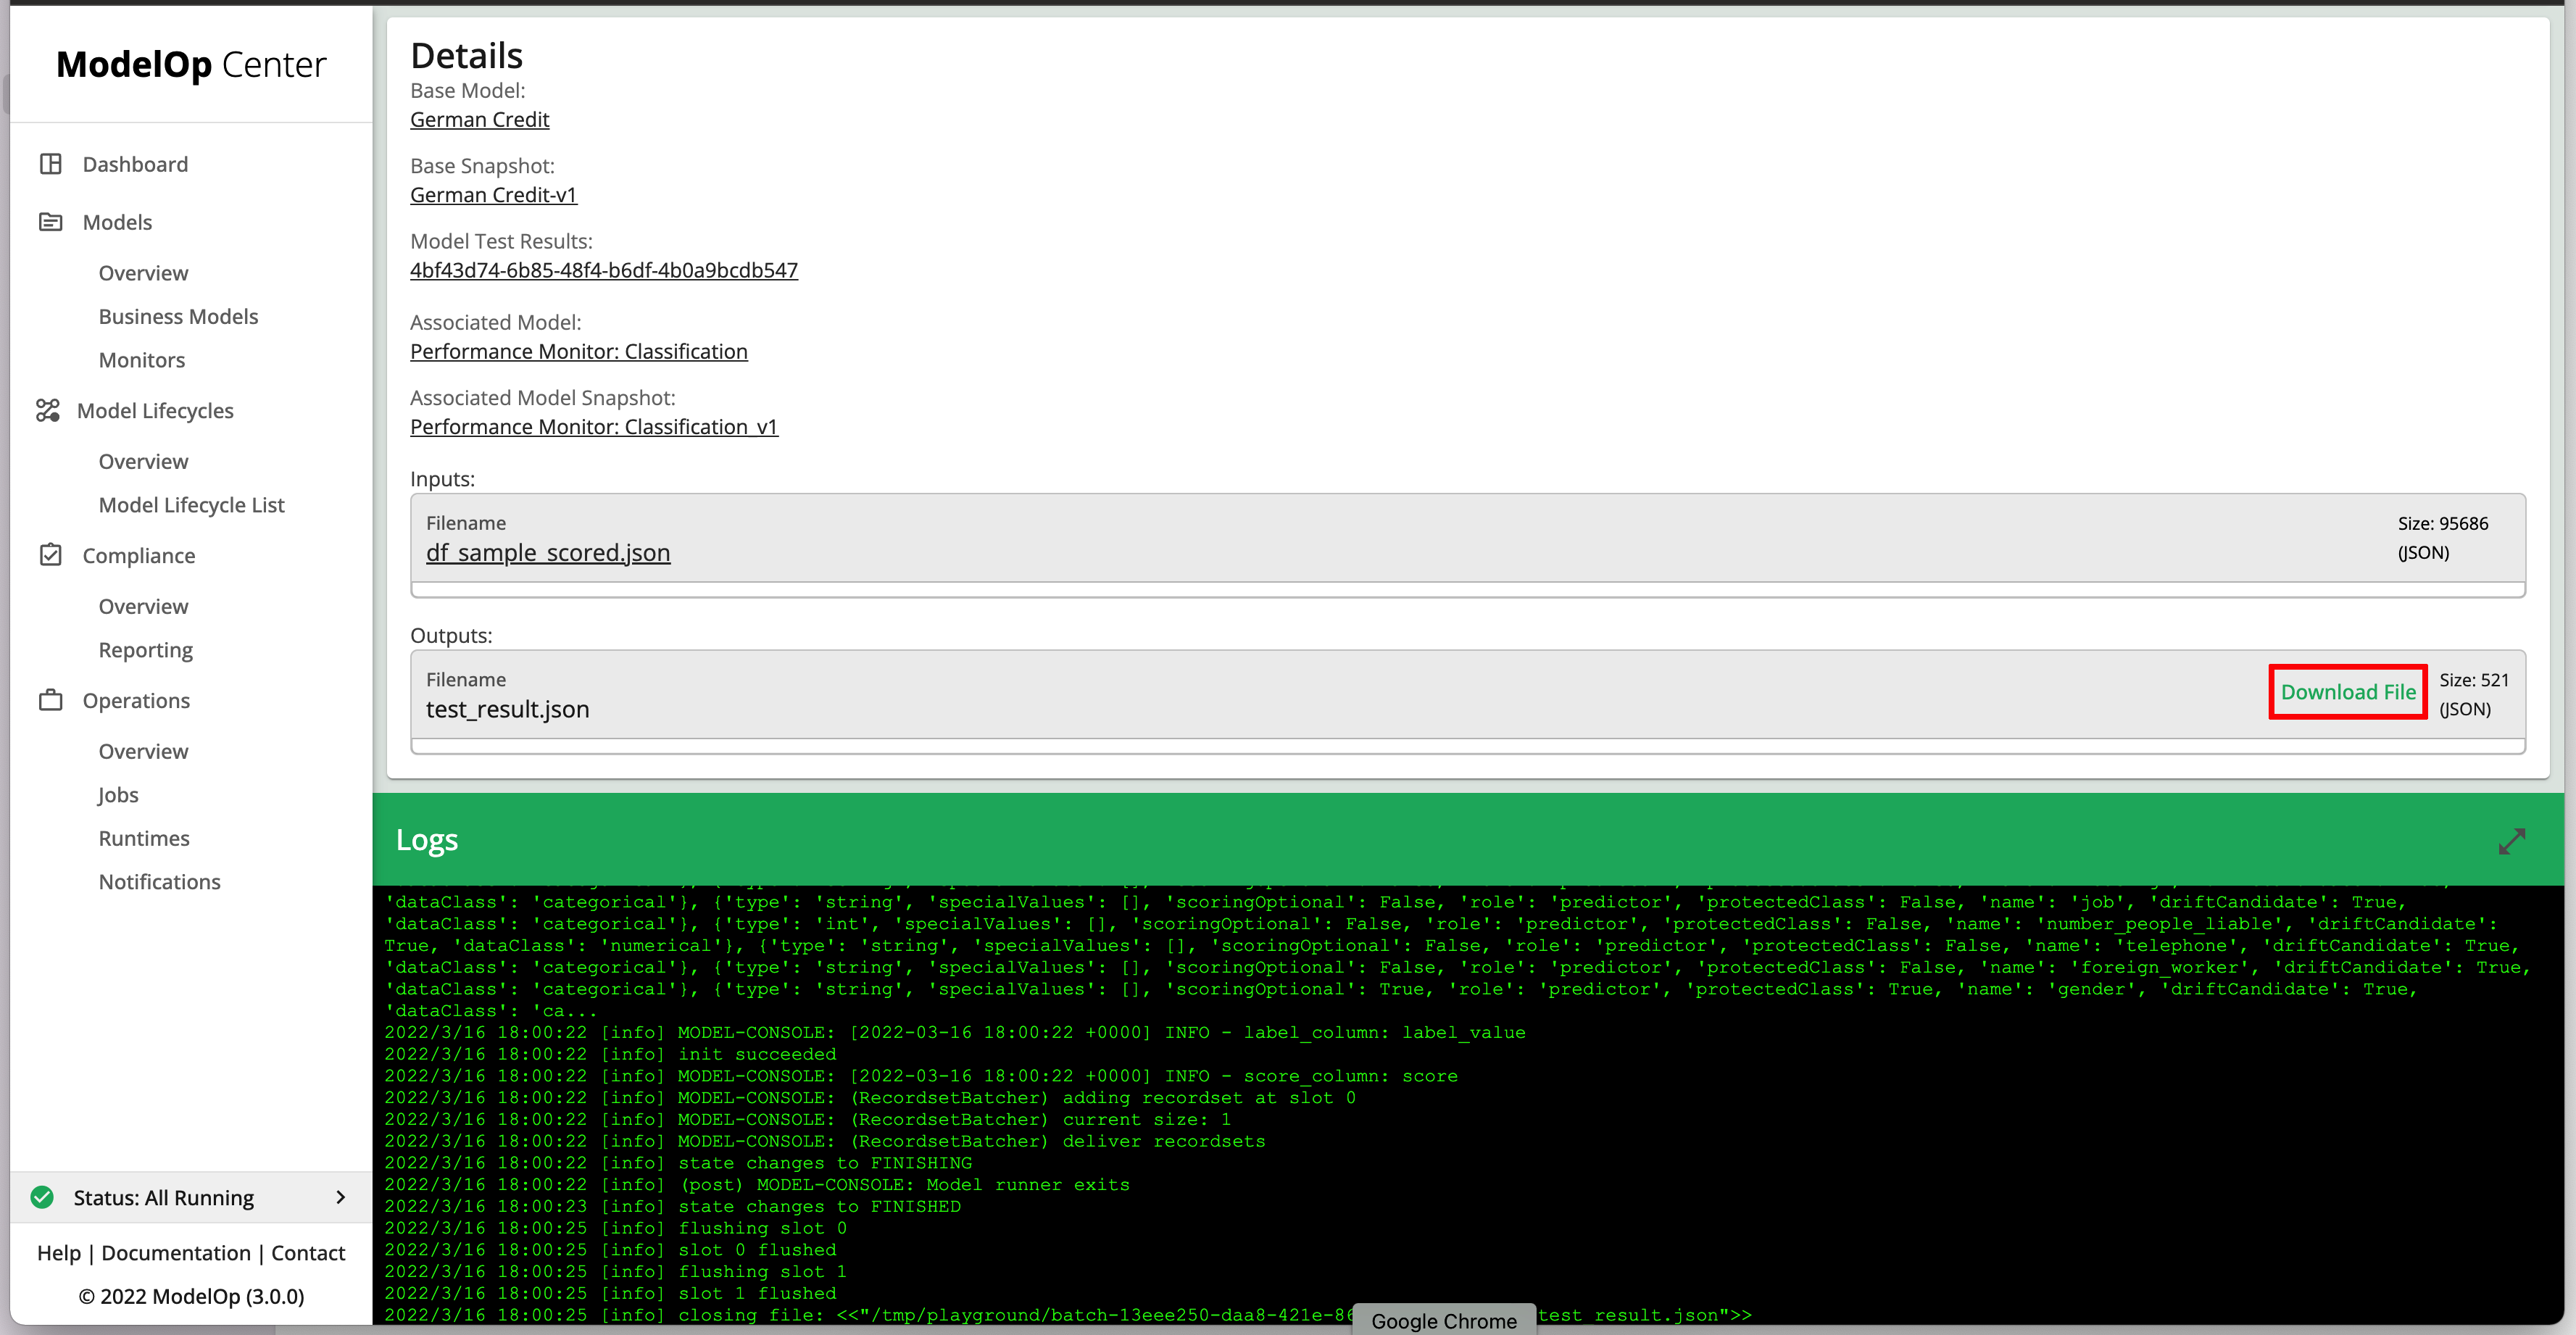
Below are the contents of the file:
| Code Block |
|---|
{
    "accuracy": 0.665,
    "precision": 0.4516,
    "recall": 0.7241,
    "auc": 0.6825,
    "f1_score": 0.5563,
    "confusion_matrix": [
        {
            "0": 0.455,
            "1": 0.255
        },
        {
            "0": 0.08,
            "1": 0.21
        }
    ],
    "performance": [
        {
            "test_name": "Classification Metrics",
            "test_category": "performance",
            "test_type": "classification_metrics",
            "test_id": "performance_classification_metrics",
            "values": {
                "accuracy": 0.665,
                "precision": 0.4516,
                "recall": 0.7241,
                "f1_score": 0.5563,
                "auc": 0.6825,
                "confusion_matrix": [
                    {
                        "0": 0.455,
                        "1": 0.255
                    },
                    {
                        "0": 0.08,
                        "1": 0.21
                    }
                ]
            }
        }
    ]
} |
Note that the first 5 key:value pairs are what gets shown in the “Summary Metrics” table.
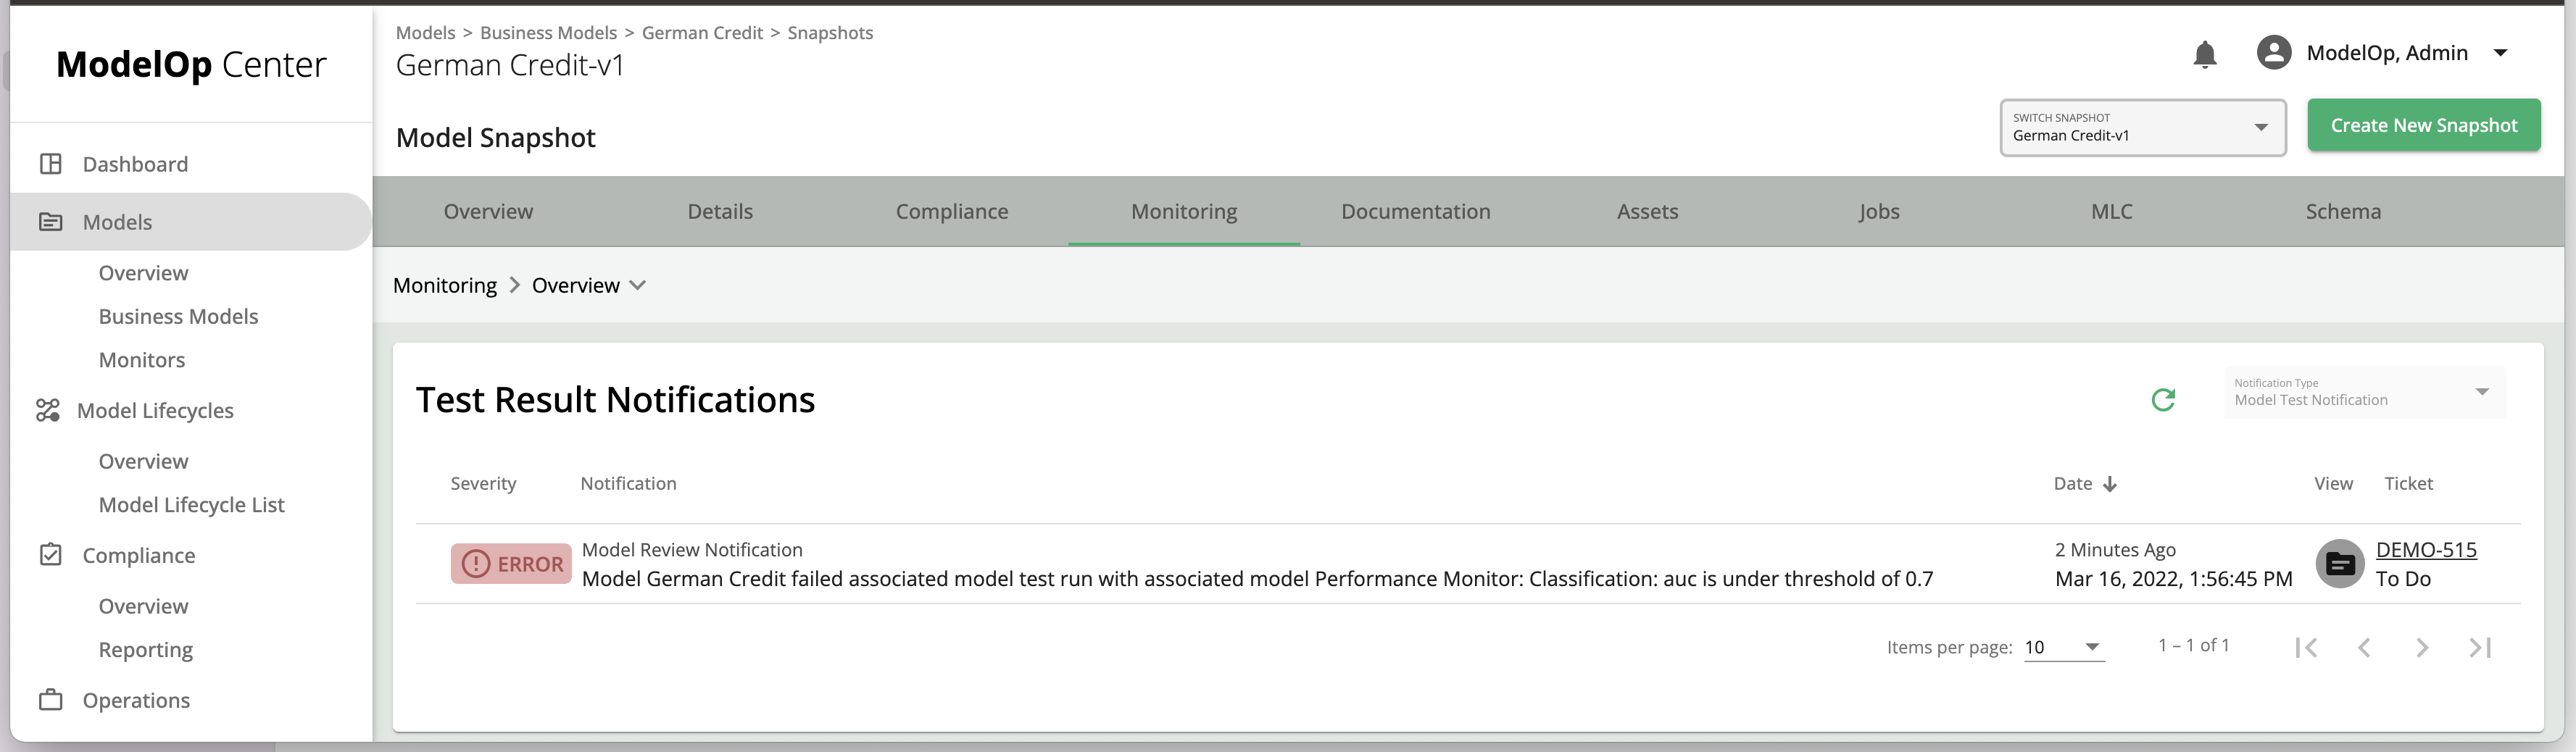
Sample Monitoring Notification
Notifications arising from monitoring jobs can be found under the corresponding model test result
Performance Monitors Details
While the types of performance metrics used will vary based on the type of model (e.g. regression vs. classification), typically a small set of statistical metrics “monitors” can be created and then simply associated to several models. This association is made during the Model Lifecycle process. The performance metrics monitor would require labeled and scored data in order to output the required metrics.
Model Assumptions
Most predictive Machine Learning (ML) models fall under one of two categories: regression or classification. Performance monitoring requires you to choose one of the two categories, as each type has differing performance metrics.
Business Models considered for performance monitoring have a few requirements:
An extended schema asset for the input data.
Data columns/types matching model type.
In the case of regression models, input data must contain a column (
predictionorscore) that contains the model output as a continuous number and a column (labelorground_truth) that contains the true label as a continuous number. These two columns will be used to calculate the regression performance metrics that the performance monitoring model will keep track of. The actual regression performance metrics that are calculated out-of-the-box are root mean squared error (RMSE), mean absolute error (MAE), and the R2 score.In the case of classification models, input data must contain a column (
predictionorscore) that contains the model output as a class and a column (labelorground_truth) that contains the true label as a continuous number. These two columns will be used to calculate the classification performance metrics that the performance monitoring model will keep track of. The actual classification metrics that are calculated out-of-the-box are accuracy, precision, recall, F1 score, AUC, and a confusion matrix.
Model Execution
During execution, performance monitors execute the following:
The
initfunction extracts the extended input schema from job JSON.monitoring parameters are set based on the schema extracted previously.
The
metricsfunction runs the appropriate performance monitoring test (classification or regression).Test results are appended to the list of
performancetests to be returned by the model, and key-value pairs are added to the top-level of the output dictionary.
For a deeper look at OOTB performance monitors, see the GitHub READMEs:
Next Article: Ethical Fairness Monitoring >